Planning the Research

The design stage often results in a proposal stating the approach the researcher will follow and the essential methodological choices he or she has made (the data collection and analysis methods he or she will use, and the observational field). These choices should always be justified in line with the research question. Although such formalization is not essential at this stage, it will be required when it comes to publishing research results. It is important to keep in mind, however, that the structure of the completed research will be evaluated, not that of the initial design. The structure conceived during the design stage can evolve during the research, as opportunities or difficulties are encountered along the way.

Notwithstanding, it is definitely not recommended that researchers omit the design stage. The design guides the course of the research and helps avoid at least some of the obstacles that can crop up in latter stages of the research. Researchers can come up against an impasse, or at least a snarl, at late stages of their research that stem from preceding stages – in which case they can be very difficult to resolve (Selltiz et al., 1976). When such problems are serious and appear late in the piece, they can waste time and demand further effort that might have been avoided. They can even appear insurmountable and halt the research entirely. For example, when a researcher, after collecting data through 300 completed questionnaires, realizes they were not given to the right people in the first place, data collection will probably have to start all over again. More forethought at the design stage would probably have made it possible to avoid this type of incident. Many problems can stem from a defective or unsatisfactory research design. Experimental results can in some cases be unusable because of the omission of a control variable. Often, the only solution is to start the experi­ment again. A thorough knowledge of the literature or the research field may help to avoid such an oversight. Statistical results may not be significant if the sample used is too small. At best the researcher will be able to increase the size of the sample, but if that is not possible, the research may have to be redirected towards another application. A good preliminary knowledge of the selected statistical method’s application conditions generally makes it possible to deter­mine the number of observations that will be required. A detailed design, pre­senting the general procedure and justifying the research components selected, will help to avoid this type of error. Planning the research and putting together an initial design should definitely be seen as a distinct and important stage of the research.

1. When to Construct a Research Design

The design stage usually comes after defining the research question and before beginning data collection (see Figure 6.2). Constructing a research design con­sists of defining the means necessary to answer the research question: selecting data collection and analysis methods and determining data types and sources (including details of sample composition and size). This is why it is useful to define the research question beforehand – even if the formulation is still a little unclear, one should at least know what one wishes to study. Of course, within the framework of constructivist or inductive approaches, the research question cannot be specified during the design stage. In this case, only the topic is defined during the development of the design: the research question is built up progressively as data is collected and analyzed (see Chapter 2).

Moreover, we recommend establishing a coherent research design before moving on to the data collection. To start collecting data without knowing how it is to be analysed entails the risk of it being inapplicable. This can also lead to the researcher wasting an observation field that can be difficult to replace, espe­cially if the phenomena under study are sensitive or out of the ordinary.

Within the framework of a doctoral dissertation, construction of a research design begins only after some months of reading and exploratory work – through which a research question is formulated. Depending on the approach chosen, these activities may take on very different forms. A researcher might carry out an exhaustive literature review as part of a hypothetico-deductive approach – leading to a conceptual framework. But a more cursory reading involving a small number of works only might be more applicable to an inductive approach. Whichever approach is chosen, constructing a research design is generally a lengthy process. Simple logical deduction is rarely enough on its own. Instead, a process of trial and error is entered upon, which continues until the researcher is satisfied that he or she has come up with a complete, coherent, and potentially

feasible design. This process often requires new reading, in particular on the general approach chosen, but also on data analysis methods and data collection and sampling techniques. Similarly, further exploration is often required, in parti­cular to find an accessible observation field and to evaluate the feasibility of the intended data collection process. For case studies, for example, a researcher might at this stage make preliminary contact with a manager of the organization chosen: not simply to gain access to the observation field, but also to specify which sources of information are available and authorized. It is also a good time to ensure that the chosen means of data collection is acceptable to all concerned.

Constructing a design is also a way to improve the precision or the formu­lation both of the research question and of the theoretical references (Grunow, 1995). Putting the research into a practical perspective makes it easier to estimate its feasibility. For example it can lead to a researcher restricting or limiting the research question if it appears too broad to be handled in its entirety. By ques­tioning methodological choices and the types of results that might stem from them, researchers can often identify inaccuracies, even omissions, in their design concept. Such revelations can return researchers to the literature, to supplement theoretical references that have proved unsatisfactory. Consequently, research design construction is an ongoing process (see Figure 6.2). It will require more or less time depending on the approach chosen, on the level of preliminary methodological knowledge, and on the difficulties encountered by the researcher in finding an appropriate field. The precision and detail of this initial design will depend on the strictness of the research approach. For example, a research design in which the researcher intends to build-up an interpretation of a pheno­menon via an in-depth case study could be limited to an outline comprising the research topic, the general approach, the choice of field and the generic data collection and analysis methods that will be used. By definition, this approach leaves great scope for flexibility, allowing new elements to emerge. But a project in which the validity of the results is closely related to the precision and control of the system will require a far more detailed design.

2. How to Construct a Research Design

Morse (1994) suggests using the normal procedure backwards, that is, to start by imagining what one might find. Imagining the expected or even the desired result often makes it possible to refine a research question and to determine appropri­ate research methods. Similarly, it is preferable to select analysis techniques before defining the data collection process in detail, as each technique has its restrictions in terms of the type of data required as well as the appropriate mode of collection.

2.1. Data analysis

A great number of data analysis methods are available, both quantitative and qualitative. Each has its own goals (comparing, structuring, classifying, describing, etc.) and sheds light on different aspects of the problem in question. The choice of analysis method depends on the research question and the type of result desired. As we have already indicated, no method is superior to another in absolute terms. The complexity of the analysis is not a guarantee of a better quality of research. Indeed, complex analysis methods are not necessarily the best adapted to the research question. Daft (1995) warns researchers that statistics are no substitute for clearly defining concepts, and that highly sophisticated statistical processing can distance the data from reality to such a point that the results become difficult to interpret.

Each analysis method depends on hypotheses that limit its conditions of use. Each one brings its own restrictions concerning the nature of the data, the number of observations necessary, or the probability distribution of these obser­vations. Choosing an analysis method requires a perfect understanding of its conditions, so that the researcher can detect in advance any factors that could make it unusable within the framework of his or her research. It is advantageous to consider various methods before making a definitive choice. Not only can this help to identify a more appropriate method than the one initially envisaged, but it is also a good way to clarify different methods’ conditions of use and to understand their limits.

By identifying a method’s limitations beforehand, researchers can consider using a second, complementary, method from the outset, to compensate for any deficiencies of the primary method and to reinforce research results. In this case, researchers must always ensure the two methods are compatible, and take account of the particular requirements of each one.

Analysis methods are not limited to those traditionally used in management research. It is more than possible to use a technique borrowed from another dis­cipline. A new method can generate new knowledge, or extend knowledge to a wider field. However, importing methods is by no means easy (Bartunek et al., 1993). The researcher has to evaluate whether the method is adaptable to the new context: this requires a detailed understanding of its limits and underlying assumptions.

2.2. Data collection

Data collection can be divided into four principal components: the type of data collected; the data collection method used; the nature of both the observation field and the sample; and data sources. Each of these components must be appropriate to the research question and the data analysis method selected – that is, research question, data collection and data analysis must be coherent. The feasibility of these choices must also be taken into account.

Identifying the data needed to investigate a research question presupposes that the researcher has a good idea about what theories are likely to explain the phenomenon. This seems obvious for research destined to test hypothe­ses using data collected through questionnaires, but can also be useful when a researcher uses an inductive procedure to explore a phenomenon. Yin (1990) argues that encouraging a researcher to begin collecting data too early in a case study is the worst piece of advice one can give. Even for exploratory research, the relevance of the data, just like the choice of participants or of observation sites, depends to an extent on researchers’ prior familiarity with the pheno­mena they study. However, the other extreme is to refrain from starting data collection on the pretext that doubts remain. Since the main contribution of exploratory study is in gaining new insights, this presupposes that the existing literature cannot explain everything beforehand.

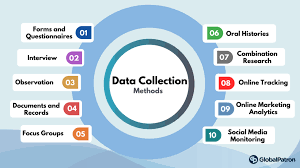
The data collection method used should enable the researcher to collect all information needed to answer the research question. Once again, many methods are possible: close-ended questionnaires, observation, verbal protocols, unstruc­tured interviews, etc. Some are better adapted than others to the collection of a given type of information, and all of them have their limitations. An inadequate data collection method can also invalidate the whole research. For example, a closed-mail questionnaire using a random sample of managers is unsuitable for research that proposes to study a subtle and intangible decision-making process (Daft, 1995). Sometimes several data collection methods can be used to increase the validity of the data. For example, ex post interviews are likely to prove insuf­ficient to reconstruct a chronological path of actions because of divergence in participants’ recollections. In this case, documents might be collected to sup­plement the data gathered from interviews or to validate it, according to the principle of triangulation.

Researchers should always ensure that the observational field can answer the research question. The size and the composition of the sample should also be determined during the design construction phase. It is useful to verify that the sample size is sufficient to implement the analysis method. At this stage, too, the researcher should define the structure of the sample (or samples) as this will affect the validity of research.

Data sources should also be taken into account when constructing a research design. In survey research, answers can differ greatly according to the respon­dent. There are particular biases associated with the hierarchical or functional position of respondents. For example, in a study of the characteristics of management control systems, a questionnaire sent to the heads of a large company might provide information about the company’s formal structure. This source, though, would probably be insufficient if the researcher wanted to know how managers used this structure, and whether they were satisfied with it. Researchers should always ensure their respondents can provide the infor­mation they are seeking. Similarly, when using secondary data, researchers should question its adequacy. Identical wording can hide different realities, according to who constructed the data and how it was collected. In the case of data collected over a period of time, the researcher could also question whether the definition and the data collection method did not change as time went on. For example, an apparent drop in a company’s workforce may reflect a down­sizing or a change in the definition of workforce, which may no longer include certain workers such as temporary labor.

Contrary to other research components, choices concerning data collection are not dictated solely by a need for coherence. Data collection often raises practical problems that result in revising the ideal guidelines the researcher had already established. Any research design is consequently a compromise between theoretical and practical considerations (Suchman, in Miller, 1991). It is therefore recommended at this stage to take account of the feasibility of the design in addition to its coherence.

Researchers should ensure the duration of the data collection phase is reasonable, and that they have enough funds to complete it. If, for example, a research question requires 40 case studies, the researcher should plan for a long period of investigation. Researchers can use assistants but, if funds are not sufficient, it would be better to revise the research design, or to reduce the scope of the research question. Similarly, in researching cultural differences, translation or travelling costs can be prohibitory, and lead the researcher to limit the number of countries under study.

Many other feasibility difficulties also exist. For example, the administra­tion of a questionnaire in an organization often requires obtaining permission (Selltiz et al., 1976). Very often, a study of an ongoing product development requires a contract of confidentiality with the company. Researchers should always evaluate whether the observational field is accessible, and estimate the consequences of possible constraints imposed by the field on the research. They should also decide whether the data collection system will be tolerated by the subjects under observation. For example, it is not easy to convince a busy execu­tive to agree to be closely observed for an entire day to record the time given over to various activities (reading of strategic reports, meetings, telephone calls, etc.). Similarly, executives do not necessarily agree to filling out daily questionnaires detailing all the people they met in the course of their work. In general, access to the field is easier when the members of the organization are interested in the results.

In an attempt to anticipate these various feasibility problems, Selltiz et al. (1976) strongly advise meeting other researchers who have worked in similar or close fields, to question them on the problems they may have faced, or even the pleasant surprises they had. Another suggestion is to explore the field before­hand, which could help to identify and resolve certain difficulties.

2.3. Expected results

The reiterative and recursive process involved in constructing a coherent design can very easily drift off course. It can produce a design in which the three elements (data collection, data processing and the expected result) may be perfectly coherent among themselves, whereas the expected result no longer answers the research question formulated at the outset. At this stage it is use­ful to evaluate once again whether the result will be coherent with the original research question. If they diverge, it may be more profitable to reformulate the question, or even to return to the stage of reviewing the literature, rather than recommencing to construct a new design to respond to the initial question. Modifying the research question at this stage does not cast doubts on the hypothetico-deductive principles of hypothesis testing, as data collection has not yet been carried out.

Researchers can also, at this stage, reassess the contribution they expect their work to make to their research domain. When hypothetico-deductive approaches are used, the answer to this question is known as soon as the research question is defined. Nevertheless, since the development of the design can lead to the ques­tion being reduced or altered, it may still be useful to question the expected contribution. It would obviously be a pity to realize at the end of the research that the results add little or nothing to the existing knowledge in the domain (Selltiz et al., 1976).

As researchers have many data collection and analysis methods at their disposal, a wide variety of designs are open to them – from those that follow a standard approach to far more complex solutions. It is therefore up to the individual researcher to put together a research design that can effectively answer the question he or she has chosen to consider.

Source: Thietart Raymond-Alain et al. (2001), Doing Management Research: A Comprehensive Guide, SAGE Publications Ltd; 1 edition.

Evolution of a Research Design

Although the relevance and coherence of the initial research design have a direct influence on the quality of later research stages, this design is by no means inalterable. Problems and opportunities will arise as the research pro­gresses, which can have an effect on the design. Meyer (1992) illustrates such evolution. His research design evolved following an event that occurred during data collection. Meyer was carrying out interviews in hospitals in the San Francisco area when doctors in the area began a general strike. This social action gave him the opportunity to turn his research into a quasi-experiment, which he did.

This section looks at a number of ways in which a design can evolve during the course of the research. We explore how to incorporate flexibility into a research approach, and how this can enable positive developments to take place as opportunities arise.

1. Design Flexibility

Thus far we have presented the various stages of research in sequential order, underlining their interdependence. It is this very interdependence which neces­sitates a coherent research design, with certain choices having a real effect on the later stages of research (Selltiz et al., 1976). However, this sequentiality is limited to the level of a general overview of the research process. In practice, research stages rarely follow a strictly linear progression: the research process does not unfold as a well-ordered sequence, where no stage can start before the preceding one is finished (Daft, 1983; Selltiz et al., 1976). Stages overlap, are postponed or put forward, repeated or refined according to the exigencies and opportunities of the research environment. The boundaries between them tend to become fuzzy. Two consecutive stages can share common elements, which can sometimes be dealt with simultaneously. According to Selltiz et al. (1976), in practice, research is a process in which the different components – reviewing existing works, data collection, data analysis, etc. – are undertaken simultane­ously, with the researcher focusing more on one or another of these activities as time passes.

The literature review is a perfect example of this. Whatever the type of design, this referral to existing works continues throughout the entire research process. Background literature is often essential for analysis and interpretation. Further reading, or rereading past works, makes it possible to refine the inter­pretation of the results and even to formulate new interpretations. Moreover, since the results of the research are not necessarily those expected, analysis can lead to a refocusing of the literature review. A researcher may decide to volun­tarily exclude some works he or she had included. Conversely, additional biblio­graphical research may need to be carried out, to explain new aspects of the question being studied. This can lead to including a group of works which, voluntarily or not, had not been explored in the beginning.

Therefore, while it is generally accepted that reading is a precondition to relevant research, it is never done once and for all. Researchers turn back to the literature frequently throughout the whole research process, the final occasion being when writing the conclusions of the research.

Some research approaches are, by nature, more iterative and more flexible than others. Generally speaking, it is frequent in case studies to acquire addi­tional data once the analysis has begun. Several factors may justify this return to the field. A need for additional data, intended to cross-check or increase the accuracy of existing information, may appear during data analysis. Researchers can also decide to suspend data collection. Researchers can reach saturation point during the data collection phase – they may feel the need to take a step back from the field. As described by Morse (1994), it is often advisable to stop data collection and begin data analysis at this point. The principle of flexibility is at the heart of certain approaches, such as grounded theory (Glaser and Strauss, 1967) where each new unit of observation is selected according to the results of analyses carried out in the preceding units. In this procedure, data collection and data analysis are carried out almost simultaneously, with fre­quent returns to the literature in an attempt to explain new facts that have been observed. These many iterations often result in refining the research question, and sometimes in redefining it entirely, according to observations and the opportunities that arise.

Experimentation, on the contrary, is a more sequential process. The data analysis phase begins only when all the data has been collected. Moreover, this data collection method is quite inflexible. An experiment cannot be modified while it is being carried out. Indeed, that would cast doubt on the very principle of control that constitutes the basis of the method. If difficulties arise, the researcher can simply stop the experiment in progress and start another. Between these extremes, investigation by questionnaire is not very flexible or evolving, but it is sometimes possible, should difficulties occur, to supplement missing information by calling back the respondent, or increasing a sample with a second series of inquiries. Thus, even within the framework of research based on stricter procedures, a return to the data collection stage remains pos­sible after the beginning of data analysis.

2. Problem Areas

Whichever the approach, various problems can emerge during research, be it during pre-tests, data collection or data analysis. These problems do not neces­sarily imply the need to change the initial design, and it is advisable to esti­mate their impact before undertaking a modification of the research design. However, in the event of significant problems, a modification of the design can be necessary – even several modifications, depending on the difficulties encountered.

2.1. Pre-tests and pilot cases

The research process generally includes activities that seldom appear in pro­posed methodologies (Selltiz et al., 1976). Fitting in between the stages of design and data collection, pre-tests and pilot cases aim to assess the feasibility of the research through evaluating the reliability and validity of the data collection tools used, be they quantitative or qualitative. While carrying out a pre-test is invaluable for research based on a very rigid design, such as experimentation, evaluating the data collection system through pre-tests can be useful for any type of design.

Questionnaires can be ‘pre-tested’ on a small sample population, mainly to check that the wording of the questions is not ambiguous. Experimental stimuli can be similarly tested, and designs based on multiple case studies can include a preliminary stage, in which a pilot case study is carried out. This is often chosen by the researcher on the basis of favorable access conditions, and will be used to assess both the proposed data collection procedures and the type of data needed to address the research question. For a single case study, the data collection system can be pre-tested at the beginning of the collection phase. For example, researchers may try to evaluate their influence on the pheno­menon under study, or test different ways of carrying out interviews.

The impact of pre-tests or pilot cases on a research project varies according to what the researcher is trying to test and the problems that are revealed. In many cases, this evaluation of the data collection system leads to reformulating or modifying the questionnaire or interview guide, without having any effect on the design. However, pre-tests and pilot cases can also reveal more fundamental problems, likely to lead to a stage of ‘reconceptualization’: new hypotheses may be defined, which will then need to be tested, or the research question itself might need to be modified. Pre-testing can even lead researchers to alter their research approach completely. A case study might be substituted for a survey if the pre-test revealed complex processes that could not be captured through a questionnaire.

2.2. Difficulties encountered during data collection

Interviewing, observing actors within an organization, or collecting documents are relatively flexible data collection methods. For example, a researcher can easily modify the course of an interview to explore a new topic raised by the respondent. If necessary, it is often possible to return to a respondent for addi­tional information. Similarly, the method used to sort information is likely to undergo modifications during the collection process. But while collecting quali­tative data is more flexible than collecting quantitative data, access to the field may be more difficult. Unexpected events during data collection can have an effect on the site chosen for the investigation – perhaps even completely calling it into question. A change in management, a modification in organizational structures, a transfer of personnel, a merger or an acquisition, or a change in shareholder structure are all likely to modify the context under study. The disturbances these events can cause may make access conditions more difficult. Respondents’ availability might decrease, and key respondents might even leave the organization. In some cases, the field may become irrelevant because of such changes, especially when it had been selected according to very precise criteria that have since disappeared.

Researchers can also find their access denied following a change in a key informant or an alteration in the management team. For example, the new mana­gers might consider the study (approved by the previous team) inopportune. While such a case is fortunately rare, many other obstacles are likely to slow down a research project, or create specific problems of validity and reliability. Research requiring a historical approach can come up against difficulties in gathering enough data, perhaps due to the loss of documents or the destruction of archival data.

Problems of confidentiality can also arise, both outside and within the organi­zation being studied (Ryan et al., 1991). For example, as the design evolves, the researcher may unexpectedly need to access a different department of the com­pany. This access could be refused for reasons of confidentiality. The researcher may obtain information that would prove embarrassing for certain participants if revealed. The planned data validation procedure might then have to be modi­fied. For example, the researcher may have planned to provide all interviewees with a summary of the information collected from each other interviewee. Such a procedure of data validation will have to be abandoned if problems of confi­dentiality arise.

Difficulties arise during data collection with less flexible research approaches too, using questionnaires or experiments – even if all precautions have been taken during the pre-test stage. Samples may be too small if the response rate is lower than expected or the database ill adapted. Measurement problems may not be detected during the pre-test phase, for example, because of a bias in the sample used for the pre-test. Indeed, pre-tests are sometimes carried out on a convenient sample whose elements are chosen because of their accessibility. Consequently, they can be somewhat removed from the characteristics of the population as a whole.

Selltiz et al. (1976) suggest several solutions to solve field problems. However, before deciding to modify the design, the researcher should evaluate the potential impact of the problems. If the research cannot be carried out under the ‘ideal’ conditions that had been defined initially, the difference between the ideal and the real conditions do not necessarily question the research validity. One solution is to carry out only minor modifications to the design, if any, and to specify the limits of the research. When problems are more significant, some parts of the research must be redone. This can be expensive, including in psy­chological terms, since the researcher has to abandon part of the work. One possibility is to find a new field in which to carry out the research. Another solution involves modifying the research design. One question can be investi­gated through different research approaches. For example, faced with difficul­ties of access to the field, research on behavior, initially based on observing actors in their organizational environment, could sometimes be reoriented towards an experimental design.

Problems encountered during data collection are not necessarily insurmount­able. The research design can often be adapted, without abandoning the initial subject, even if in some cases an entirely new design has to be formulated.

2.3. Difficulties encountered during data analysis

Whatever approach is adopted, obstacles can appear during the analysis phase. These obstacles will often ultimately enrich the initial design as new elements – new data collection processes or new analyses – are included, to increase the reliability of the results or improve their interpretation.

Analysis and interpretation difficulties are frequent with qualitative research approaches. These may lead researchers to return to the field, using, for example, different data collection methods to supplement information they already have. Such new data might be analysed in the same way as the previously collected data, or it might be processed apart from the previous data. If an ethnographic approach is used, for example, a questionnaire could complement data collec­ted by observation.

A researcher may find it impossible to formulate satisfactory conclusions from the analysed data. In a hypotheses-testing approach, survey or databases results may lack of significance, especially when the sample is too small. In this case, the conclusions will be unclear. If sample size cannot be increased, one solution is to apply another data analysis method to replace or complement those already carried out. In a hypothetico-deductive approach, the data collected may lead to rejecting the majority of, or even all, the hypotheses tested. This result constitutes in itself a contribution to the research. However, the contribution will be improved if this leads the researcher to propose a new theoretical framework (Daft, 1995). Comparing research results with existing literature, in particular in other domains, can help researchers to formulate new hypotheses and adapt the conceptual framework they use. These new proposals, which have enriched the research, may be tested later by other researchers. A qualitative approach can also produce new hypotheses. For example, research initially centered on testing hypotheses that have been deduced from existing models could be supplemented by an in-depth case study.

Obstacles confronted during the analysis stage can often result in modifying the initial research design. While this generally consists of adjusting or adding to the design, sometimes it will have to be abandoned entirely. This is the case, for example, when an ethnographic approach is replaced by an experimentation.

3. General Design Process

While an initial design can hopefully pinpoint uncertain areas, in order to avoid the emergence of problems in later stages of the research, this does not guarantee that difficulties will not arise requiring either adjustments or even more significant modifications to the design. Yet design evolution is not neces­sarily due to difficulties occurring during the course of research. As we saw at the beginning of this third section, this evolution can be the result of iterations and flexibility inherent to the approach. It can also be the result of opportun­ities arising at various stages of the research. Collected data, a first data analy­sis, a comment from a colleague, a new reading or an opportunity to access a new field are all means of bringing forward new ideas, hypotheses or explana­tory or comprehensive models. These may lead researchers to reconsider the analysis framework, to modify the research question or even to give up the ini­tial approach in favor of a new one that they now consider more relevant.

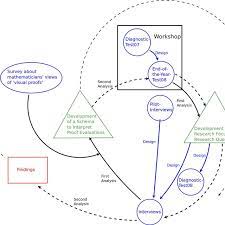
Constructing the final research design is an evolutionary process. It gene­rally includes an amount of looping back and repeating stages, both when putting together the initial design and later on in the research (see Figure 6.3).

The actual construction of a research design is thus a complex, evolving, uncertain process. A sufficient level of residual uncertainty in a research design determines its interest and quality (Daft, 1983). This is why, according to Daft, research is based more on expertise than knowledge. This skill is acquired through a learning process, based on experience and frequenting the field. Research quality depends largely on how well prepared the researcher is. Researchers, in order to succeed, must possess certain qualities and disposi­tions: wisdom and expertise during data collection; perseverance and meticu­lousness in the analysis phase; along with a solid theoretical training and a taste for uncertainty (Morse, 1994; Daft, 1983; 1995).

Source: Thietart Raymond-Alain et al. (2001), Doing Management Research: A Comprehensive Guide, SAGE Publications Ltd; 1 edition.

Linking Concepts and Data

Two essential modus operandi can be distinguished in management research. Researchers tend to either compare theory to an observed reality, or they try to elicit theoretical elements from reality. In practice this means that, once a research problem has been defined and the researcher has chosen the type of research to undertake, he or she is faced with two possibilities: either to study the literature and extract concepts from it, or to explore reality through field­work. The researcher thus assembles either a group of concepts or a body of data. The accumulation of concepts then leads to speculation on the type of data to collect to study these concepts in action, while the accumulation of data leads the researcher to attempt to reveal the concepts underlying this data. Whatever the situation, researchers try to establish links between concepts and data, employing two translation processes to do so: measurement and abstraction.

Measurement involves the ‘translation’ of concepts into data, and abstrac­tion the ‘translation’ of data into concepts (it should be noted that, in this chap­ter, measurement carries the same significance as the traditional concepts of operationalization or instrumentation). Researchers rely on measurement tools and abstraction processes to carry out these translations. Either existing measurements or measurements created by the researcher may be used when translating concepts into data. In translating data into concepts, researchers employ various methods to put together the data they have collected.

Source: Thietart Raymond-Alain et al. (2001), Doing Management Research: A Comprehensive Guide, SAGE Publications Ltd; 1 edition.

The Translation Process of the Research

In this section we introduce and outline the principle elements that characterize the translation process.

1. Concepts and Data

1.1. The theoretical realm

The theoretical realm encompasses all the knowledge, concepts, models and theories available, or in the process of being constructed, in the literature on a subject. With respect to translation, however, researchers are primarily con­cerned with concepts – or to be more precise, with their particular definition of each concept studied. For example, Venkatraman and Grant (1986) found that the concept of strategy is defined in numerous different ways in management research. Rather than being a question of one term referring to multiple con­cepts, it is more a case of a number of different perspectives being grouped together under one label. Zaltman et al. (1973) also make a valuable distinction between a concept and the terms used to designate it. Consequently, although reading through the literature is the starting point of the research design process, conceptual definitions adopted by the researcher will always condition the translation process he or she employs. For this reason, throughout this chapter the term ‘concept’ should be understood as synonymous with ‘concep­tual definition’.

1.2. The empirical realm

The empirical realm encompasses all the data that can be either collected or made use of on the field. This data may include facts (a meeting, the date of an event), opinions, attitudes, observations (of reactions or behaviors) or docu­ments (files, reports). When embarking upon a work of research in manage­ment, researchers delimit, by their interest and their attention, an area of study within this empirical realm. This area can relate to a branch of industry, to a population of organizations or a single company, or to particular groups of actors. Moreover, the fieldworker’s presence may demarcate this area of study in time; thus it may comprise the lifespan of the studied phenomenon – for example, a project, a structural reform or a change of leadership. Mintzberg (1973), in his study of the role of the manager, defined an area within an empirical realm delimited in space (managers and their activities) and in time (daily life).

When researchers base themselves in the empirical realm, they have a cir­cumscribed body – or a ‘closed set’ (De Groot, 1969) – of data (facts, opinions, attitudes, observations and documents) at their disposal. Although this data often approximates conceptual items, empirical elements are never able to represent completely, nor to duplicate, the significance of the underlying theo­retical concepts (Zeller and Carmines, 1980).

2. Moving from One Realm to the Other

Whichever realm (theoretical or empirical) they are working in, researchers have particular elements at their disposal (concepts or data). To move from one realm to the other, these elements have to be construed in the language of the second realm (Zeller and Carmines, 1980). To go from the theoretical to the empirical involves translating a conceptual definition in order to pinpoint ele­ments of the empirical realm that most closely illustrate it. When, on the other hand, a researcher wants to link empirical elements to the theoretical realm, data collected in the field has to be translated into the concepts that underlie it.

As the following example illustrates, a conceptual definition has no objective correspondence in the empirical realm. That is to say, for any given concept – any given conceptual definition – there is no empirical data that corresponds exclusively to it. Similarly, researchers who wish to move from the empirical to the theoretical work from elements (data) that may be understood to be the manifestation of any of a number of potential concepts.

Example: Non-exclusive correspondence

A researcher may choose to consider the concept of high velocity environments either through the annual rate of innovation within a sector, or through the rate of the renewal of skills within companies operating in this sector. However, the empiri­cal element ‘rate of the renewal of skills within companies’ could also be used to consider the concept of resources when looking at the correlation between a com­pany’s resources and its performance.

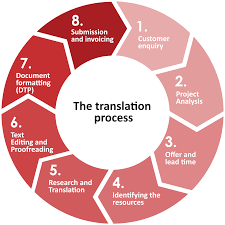
As Figure 7.1 illustrates, the translation process consists essentially of con­necting a concept to one or more empirical elements (when the researcher has been operating in the theoretical realm) or of connecting one or more empirical elements to a concept (when the researcher has been operating in the empirical realm).

The theoretical and the empirical realms offer the researcher resources of quite different natures (conceptual definitions on the one hand, empirical ele­ments on the other). As we will see, the translation process involves two dis­tinct processes, and the form it takes is closely related to the realm in which the researcher first starts to think about a problem. We call the passage from the theoretical to the empirical ‘measurement’, and the opposite process, which takes us from the empirical towards the theoretical, ‘abstraction’.

2.1. Measurement

Several definitions of ‘measurement’ have been proposed by writers in the social sciences. The definition we will use here, is that of DiRenzo (1966), to whom measurement ‘refers to the procedures by which empirical observations are made in order . . . to represent the conceptualizations that are to be expla­ined’. According to Larzarsfeld (1967), however, measurement must be consi­dered in a broader sense in the social sciences than in fields such as physics or biology. A researcher in the social sciences may take measurements that are not necessarily expressed in numbers, in which case the measurement process comprises three, or perhaps four, principal stages. These stages are outlined below.

2.2. Abstraction

In the above example we considered a situation in which the researcher moved from the theoretical to the empirical realm. However, research work in manage­ment can also begin in the empirical realm, in which case the translation process is no longer a question of taking a measurement, but instead requires the researcher to operate an abstraction. The researcher accumulates a body of data, which he or she then tries to reassemble within a broader framework from which an underlying conceptualization may be established.

For this translation – or abstraction – process, the researcher carries out pro­gressive regroupings of the empirical data collected, so as to draw out more conceptual elements from the facts, observations and documents at hand. The researcher codes the data, formulates indicators (Lazarsfeld, 1967), establishes categories, discovers their properties and, finally, attempts to propose a con­ceptual definition. As we shall see, abstraction may serve either a descriptive or a theoretical purpose.

We have seen that the researcher can operate in either the theoretical or the empirical realm. We have also seen that the translation process entails ques­tioning how we can move from one realm into the other. More precisely, it involves translating the elements researchers have at their disposal initially, into the language of the realm to which they wish to go. In the case of measurement, the translation process consists of establishing indicators that correspond to a given concept. In the case of abstraction, the translation process entails decid­ing how the data that has been gathered is to be categorized.

3. Translation Methods

Several resources are available to the researcher when establishing connections between concepts and data. We will look first at measuring instruments, and then we will consider abstraction processes.

3.1. Measurement instruments

Understanding the nature of indicators The object of measurement is to estab­lish indicators that correspond to a given concept. These indicators make it pos­sible to associate a value or a symbol with part of the concept, which is why we refer to them as measurement instruments. Either a single indicator alone or a group of indicators can constitute a measurement instrument. Boyd (1990) uses a number of indicators to measure the complexity of an environment, including geographical concentration, the number of firms in the industry and the distri­bution of market shares. At the same time, however, he uses a single indicator – the rate of sales growth – to measure the environment’s dynamism. Indicators can also help the researcher to determine the type of data to collect. In measuring the technological intensity of intercorporate alliances by the ratio of research and development budget to sales, for example, Osborn and Baughn (1990) were led to compile a precise type of information on the firms they studied – putting together a resister of their average research and development budgets and sales figures.

Measurement instruments can be qualitative or quantitative. In their research into the relationship between strategy-making and environment, Miller and Friesen (1983) used a variable broken down into seven items to represent changes that might occur in a company’s external environment. A seven-point Likert scale was associated with each of these items. For example, actors were asked to give the following sentence a rating from 1 to 7 (from complete agree­ment to total disagreement): ‘The tastes and preferences of your customers in your principal industry are becoming more stable and more foreseeable’. The measures used were metric and the indicator quantitative – as they were in Osborn and Baughn’s research, where the instrument used to measure the technological intensity of intercorporate alliances was a ratio of numerical data.

Controlling the number of indicators Several indicators can usually be found for a given concept. This means that a researcher working on environmental dynamism will find various types of indicators used in the literature. In Miller and Friesen (1983), for example, this concept is measured by the actors’ per­ceptions of the amount and the predictability of change occurring within an environment (in areas of consumer tastes, production techniques and ways in which companies competed). Boyd (1990), however, measures the concept of environmental dynamism purely on the rate of sales growth.

Pre-existent correspondences between concepts and indicators are available to researchers in the form of proxies. Used often in research in management, a proxy is an indirect measurement of a concept. Performance, for instance, can be measured by the proxy: ‘share prices’. Similarly, the turbulence of a branch of industry can be measured by the proxy: ‘number of companies entering and leaving the sector’. There are also instruments for which the number of indica­tors is preset, as illustrated by the work of Miller and Friesen (1983). When researchers use this type of instrument they are typically led to calculate an index: for example, the average of the ratings given to each of the seven items.

In this way, the researcher – as Lazarsfeld (1967) recommends – can define indicators using measuring instruments other than graded scales. Such indica­tors are particular combinations of indicators that can synthesize a part of a concept. The researcher must take care, however, not to misrepresent or distort the relationship that each of the indicators included have to this concept. For example, a researcher may decide to measure performance by constructing an index expressed by the ratio of turnover to profits. In this case he or she must ensure that variations in the two indicators are reflected by an equally significant variation in the index. The researcher who expects increased performance to be reflected in an increase in turnover and profits, also expects an increase in this index. But where are we then? The increase in the numerator is compensated by that of the denominator: the index remains stable, and the measure becomes inoperative.

3.2. Abstraction methods

If researchers decide to begin their work in the empirical realm, they start out with a body of related empirical data which they then have to interpret. This process entails questioning the level of abstraction to which they wish to subject these empirical elements. They may try to propose a concept or a body of inter­related concepts, or even to establish a model or a theory. The level of abstrac­tion initially envisaged by the researcher has an influence on the level of sophistication of the processes and methods that will be used to carry out this abstraction.

In the abstraction process, researchers are confronted with the problem of coding the empirical elements they have collected. Strauss and Corbin (1990) identify three methods of coding data: open, axial and selective.

Open coding Open coding basically consists of naming and categorizing phenomena by thoroughly examining the data collected in relation to it. By collating this data and classifying it into categories – sets and subsets – the researcher can progressively reduce the number of units that are to be mani­pulated. The researcher then has to try to label these categories. While in some cases existing conceptual definitions can be compared with these new cate­gories and found to be appropriate, it is generally advisable to try to propose original definitions, drawn from fieldwork. Glaser (1978) refers to such defini­tions as ‘in vivo’. Once established, these categories should be refined by high­lighting their intrinsic properties and the continuum along which they may fluctuate.

Axial coding A researcher can make the abstraction process more sophisticated by using axial coding. Based on the same principle as open coding, axial cod­ing goes further to specify each category in terms of causality, context, actions and interactions, and their consequences.

Selective coding The principle of selective coding consists in going beyond simple description and towards conceptualization. This involves theoretical integration or construction (Strauss and Corbin, 1990). Selective coding aims at defining a central category, to which the researcher tries to link up all of the properties of the categories that have been established previously. Strongly con­nected to this type of abstraction process is the idea of identifying what Schatzman and Strauss (1973) call a ‘key linkage’. This can refer to a metaphor, a model, a general outline or a guiding principle that researchers can use to group their data.

Key linkage serves as a basis for grouping not only data, but also the cate­gories themselves (through similarities in properties and dimensions). After carrying out this abstraction, the researcher obtains central categories that are connected not only on a broad conceptual level, but also to each specific pro­perty of the other categories.

Source: Thietart Raymond-Alain et al. (2001), Doing Management Research: A Comprehensive Guide, SAGE Publications Ltd; 1 edition.

Designing the Translation Process of the Research

1. Measurement

Measurement is the process by which we translate from the theoretical realm to the empirical. Once researchers have selected a concept, they have to find a way to measure it – that is, to identify the type of data they need to collect. Drawing on previous works, the researcher begins by looking at how the con­cept has been interpreted, or translated, in the past. Studying works by other writers can reveal existing translations that may be directly usable, or could be a basis from which certain adjustments need to be made. If these translations appear unsatisfactory, or unsuited to the current study, then the researcher moves to the second stage of the measurement process, that of developing new translations either by improving existing ones or through innovation.

1.1. Drawing on previous works

Once they have located measurements used in previous works, researchers have to choose among them and, if necessary, consider how they can be adapted to the particular context of their own work.

Finding measures When researchers begin in the theoretical realm, they have access to a body of work with differing levels of relevance to their own field. Published articles, doctorate theses and other works can be used as a basis from which to formulate conceptual definitions or look for available measurements. Table 7.1 illustrates several measurements.

Choosing measurement instruments To select the measurement instruments most appropriate to their work, researchers need to consider three criteria: 1) reliability, 2) validity and 3) operational feasibility. As reliability and validity are discussed at length in Chapter 10, here we will look only at the third criteria: operational ‘feasibility’. Although a number of writers have discussed operational feasibility as a selection criterion (Black and Champion, 1976; De Groot, 1969), it is a quality that is best appreciated by drawing on one’s own experience of using a specific measurement.

For example, when considering a scale, operational feasibility is a question of how easy it is to read (the number of items included) and to understand (the vocabulary used). Operational feasibility also relates to the sensitivity of the measurement instruments used, as they need to be able to record subtle varia­tions of the measured concept. The following example illustrates this.

Example: Sensitivity of the measurement instrument

In studying sector-based change in the pharmaceutical industry, a researcher chose to measure the concentration of the sector by calculating the number of companies operating within it. However, she felt that this instrument was not sufficiently sensitive to measure variations in the concept of concentration, as it did not take the size of the companies entering or leaving the sector into account.

Although a company leaving a sector does have an impact on its concentration, the measurement of this variation is identical, whatever the size of the departing company. Yet the size of the companies within the sector can be a significant characteristic of the concept of concentration. The researcher decided to refine the measurement by counting companies according to the following principle: she associated a weighting of almost 1 to large companies, and a weighting closer to 0 for smaller ones.

Even if the measurement instruments used fulfill the requirements of relia­bility, validity and operational feasibility, researchers may often feel the instru­ments selected still need to be adapted to suit their particular context.

Making necessary adjustments The research process entails a targeted approach to the empirical world. Researchers should bear this in mind, whether they are interested in a branch of industry, a type of company, or a given type of actors. By taking this into account, as the following example shows, researchers can contextualize the measuring instruments they use.

Example: Contextualized measurement instruments

In a study that encompassed nearly 100 multinational companies, a researcher looked at the influence of the psycho-sociological characteristics of the members of the board of directors on the success of fusion takeovers. He prepared a question­naire to measure localization of control, interpersonnel confidence and the social anxiety of board members. Only those companies that had bought out others (and not companies which had been bought out themselves) were included in the study, which concentrated on four branches of industry: pharmaceutical, banking, and the insurance and communication sectors.

The researcher chose to address his questionnaire to every board member from each of the companies in his sample. This obliged him to re-examine the formula­tion of certain questions so that they were better adapted to the respondents’ areas of expertise (commercial, financial, accounts, legal). In this particular research pro­ject, however, an additional adjustment was necessary. As the work concerned multinational corporations, the researcher had to translate his measurement instruments, originally conceived in American English, into German, French and Japanese.

Adapting measurement instruments found in published literature to make them more applicable to a new research project can often entail additional work on the part of the researcher.

1.2. Ameliorate or innovate?

When the literature does not furnish satisfactory measurement instruments to measure a given concept, researchers are faced with two possibilities. They can either make significant modifications to available measurement instruments, adapting them to their requirements, or, if none are available at all, they can innovate by constructing their own measurements.

For example, in measuring the concept of performance, a researcher might innovate by using the monthly rate of change in share market prices. This could seem more suitable to his or her needs than another, existing, measurement using the ratio of profit to turnover. If a researcher wishes to use a given scale to measure theoretical items, the scale may be improved by removing, adding or substituting certain items.

It is important to stress that improving or creating measurement instru­ments is a quasi-integral part of the translation process. Of course, whatever the degree of innovation introduced by the researcher, the measurement instruments constructed must always answer to the requirements of reliabil­ity, validity and operational ‘feasibility’. The degree to which these require­ments are satisfied determines the limits of the research, and the scope of its results.

Unlike the translation process, which is based on the construction of a measure­ment, either drawing on existing measurements or adapting them to suit their needs, the abstraction process follows an opposite course. Through abstraction, researchers attempt to establish correspondences, which may be formalized to varying degrees, between the data they have accumulated (behavioral obser­vations, figures, etc.) and underlying concepts – they have to identify the con­cepts hidden behind their data. In the abstraction process, researchers do not so much aim at processing their data in any definitive way, but at understanding it as accurately as possible.

1.3. Grouping and classifying data

The abstraction process consists of discovering classes of facts, people and events, along with the properties that characterize them. The data a researcher has access to depends essentially on his or her initial field of investigation, which can be used to identify ‘key linkages’ (Schatzman and Strauss, 1973). Key linkages provide researchers with an order of priorities (or attribution rules) when classifying their data.

A number of different principles of data classification have been proposed (Glaser and Strauss, 1967; Lazarsfeld, 1967; Miles and Huberman, 1984a; Schatzman and Strauss, 1973; Strauss and Corbin, 1990). Classes can be estab­lished through comparison, using the principle of similarities between pheno­mena. Such classes are generally referred to as thematic. For example, in studying the daily activities of an operational unit, a researcher may collect a variety of empirical data – such as notes, memos and exchanges – in which he or she finds words, sentences or parts of text of the type: ‘do not forget to write a daily report of your activities’, ‘we remind you that latecomers will be penalized’, and ‘please respect the pricing policy’. The researcher can group these elements together by creating a thematic class ‘reminders of operational rules’.

Researchers can also establish categories according to a chronological principle – respecting the chronological order of the data. Events that occur simultaneously may, for instance, be differentiated from those that occur sequentially. In the study that looked at the activities of a production plant, the researcher could have ordered his or her data according to the idea of action- reaction chains. This involves classifying events by the order they happen: 1) the decision is made to increase productivity; 2) the rate of absenteeism increases. Similarly, the researcher could classify data according to the idea of simultaneous occurrence (the reaction of the workers and the reaction of the supervisors following the directive to increase production).

Categories may also be determined by structural level of complexity. Data is then collated by distinguishing among the different levels of analysis to which they refer. For example, an actor could be classified according to the department in which he or she works, the company in which he or she is employed or the sector the company is in. Another classification possibility relies on more general conceptual ideas, ordering data according to its degree of abstraction. The idea that ‘productivity is closely related to employee satisfaction’ can be classified as an individual belief or as a more abstract phenomenon, such as a collective representation.

Data can also be grouped by considering all possible combinations in terms of categories. This can be facilitated by using appropriate indicators, as the fol­lowing example, taken from Glaser and Strauss (1967: 211), demonstrates.

Example: Using indicators to construct theory from quantitative data

Glaser and Strauss (1967) developed an example of constructing theoretical ele­ments from quantitative data, by studying the role of professional recognition on scientists’ motivation. The underlying idea in their study was that recognition is induced by motivation, and that motivation leads to greater recognition.

After collating the information they collected, in order to better understand the relationships between them, Glaser and Straus then sorted the data by creating groups of individuals, based on precise characteristics. They formulated indicators to differentiate the various groups – their initial research outline leading them to construct indicators related to the concepts of recognition and motivation. By com­bining the modalities they had used to measure the concepts of recognition and motivation, namely high levels and low levels, Glaser and Strauss obtained the following indicators: ‘high motivation/low recognition’, ‘high motivation/ high recognition’, ‘low motivation/low recognition’ and ‘low motivation/high recognition’.

These indicators enabled them to differentiate between, and to compare, groups of individuals. More precisely, the authors compared the relative frequency of these various groups to that of a group for which they distinguished only the level of motivation. They found that when motivation was very high there was a difference in the frequency of groups with low recognition and those with high recognition. The comparison allowed them to demonstrate that the effect of recognition is modi­fied by the group’s level of motivation.

This example shows how indicators can be used in the abstraction process. By associating level of performance, level of motivation, and level of recognition, effec­tive conceptual tools were developed. The index ‘high performance/high motiva­tion’ could therefore be referred to as the ‘recursive impact of effort’ – as suggested by literature in human resource management.

Communicating with other researchers can be useful when applying cate­gorization methods. Talking about their work can help researchers present their research more clearly, and to understand their data in a different light than they might through simply writing about it. This effort clearly tends to objectify the data and any interconnections that naturally appear. As Schatzman and Strauss (1973) put it, an audience serves as a ‘conceptual lever’.

The usefulness of these different methods of categorization – as to both the accuracy of the categories and their relevance to the data from which they were created – is appreciated essentially through trial and error (Strauss and Corbin, 1990). To ensure the precision of the abstraction process they employ, or to supplement this process, researchers can draw on formal classification methods (see Chapter 12).

Finally, the researcher too can be considered as an instrument. This concept is closely associated with ethnographic approaches. As Sanday maintains, ‘field- workers learn to use themselves as the principal and most reliable instrument of observation, selection, coordination, and interpretation’ (1979: 527). The trans­lation process is therefore influenced by qualities inherent to the researcher. However, little is known about the nature of this influence. In his book Works and Lives, Geertz (1988), points out that ethnographic work takes on a particular dimension from even the style the researcher uses when transcribing his or her results. The title of his work evokes the ambiguity of the researcher-instrument. There are two realities: that which is studied (there) and that which is recon­structed (here). In studying the style employed by ethnographic researchers, Geertz focuses on transcriptions of research works that do not appear to be objective. This ‘deviance’ is, however, involuntary – it is inherent in the style of writing. In the effort of conceptualization, ethnographers almost unconsciously try to mask or to promote their own behaviors or attitudes. This can lead to abstractions that have followed somewhat inaccurate guidelines.

Ethnographic work often involves significant immersion of the researcher- instrument in the empirical realm. This immersion is punctuated by periods of intense pleasure and joy, but also by other feelings and more somber emotional states. The natural growth and change that occurs to researchers while carrying out their research modifies the instrument that they themselves represent. This is manifested most particularly in the actors’ perception of the researcher. A change in researchers’ behavior can modify the answers they are given or the behavior they observe thereafter. As Barley (1990) noted, researchers are often afraid to make a faux pas, and this fear can lead them to becoming self-con­scious – preoccupied with the image they project. This can eventually even divert them from their research object. Drawing on his own experience, Barley explained how, while carrying out research on hospitals, he tried to avoid any discussions that might touch on strongly emotional subjects, accentuating or adapting his behavior at times, and controlling himself from expressing his true beliefs and opinions on sensitive subjects: ‘even though I could not bring myself to laugh at racist or sexist jokes, I also did not confront their tellers’, (1990: 238). Such inhibition cannot be systematic, though, and researchers can help themselves in this respect by taking regular notes on their current emo­tional states, so that they can ‘contextualize’ their observations when they read them back at a later date.

Source: Thietart Raymond-Alain et al. (2001), Doing Management Research: A Comprehensive Guide, SAGE Publications Ltd; 1 edition.

Sampling in Research

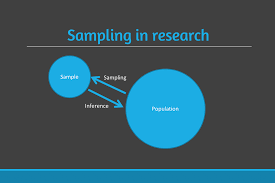
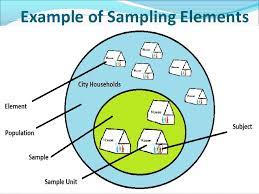
Most statistics handbooks define a sample as a subset of elements drawn from a larger unit called a population. In this chapter, however, we use the term ‘sample’ in a broader sense. A sample is defined as the set of elements from which data is collected. We thus are interested in all types of samples; what­ever their size, their nature, the method of selection used and the aims of the study – from the sample comprising only one element, selected by judgement and intended for qualitative processing, to large-scale random sampling aimed at testing hypotheses using advanced statistical techniques. The chapter pre­sents the range of options open to the researcher when drawing a sample, and guides the researcher’s choice by indicating the main criteria to be taken into account.

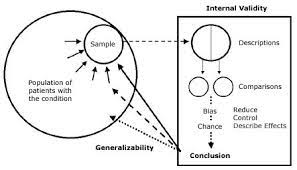
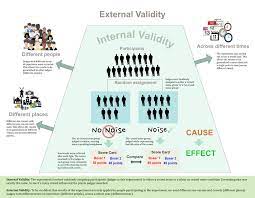
Choices made when drawing a sample will have a determining impact on the external validity as much as the internal validity of the study. External validity refers to the possibility of extrapolating the results obtained from a sample to other elements, under different conditions of time and place. Internal validity consists in ensuring the relevance and internal coherence of the results in line with the researcher’s stated objectives. The validity of a study can be linked to three characteristics of the sample: the nature (heterogeneous or homogeneous) of the elements it is composed of; the method used to select these elements; and the number of elements selected.

Various methods can be used to establish a sample. These differ essentially in the way elements are selected and the size of the sample. Choices made con­cerning these two questions have implications in terms of both possible biases and the potential to generalize from the results. It therefore seems essential to be familiar with the various ways sample elements can be selected, and the criteria to consider when determining sample size, before deciding upon a sampling method.

Source: Thietart Raymond-Alain et al. (2001), Doing Management Research: A Comprehensive Guide, SAGE Publications Ltd; 1 edition.

Selecting Research Sample Elements

1. Sampling Methods

External validity can be achieved by employing one of two types of inference: statistical or theoretical. Statistical inference uses mathematical properties to generalize from results obtained from a sample to the population from which it was taken. Theoretical inference (or analytical generalization) is another form of generalization, but one that is not based on mathematical statistics. Rather than aiming to generalize from statistical results to a population, theoretical inference aims to generalize across populations on the basis of logical reasoning.

The different sample selection methods can be grouped into four categories (see Figure 8.1). These categories do not employ the same modes of inference. The first category is made up of probability sampling methods, in which each element of a population has a known probability, not equal to zero, of being selected into the sample. These are the only methods that allow the use of statistical inference.

Unlike probability sampling, in which researcher subjectivity is to be elimi­nated as far as possible, the second category is composed of methods based on personal judgement. Elements are selected according to precise criteria, estab­lished by the researcher. The results obtained from a judgement sample lend themselves to an analytical type of generalization.

The third category corresponds to the quota method. Not being a probability sampling method, quota sampling does not, strictly speaking, allow for statisti­cal inference, however, in certain conditions which will be described later, quota sampling can be similar to probability sampling, and statistical inference can then be applied.

Convenience sampling methods make up the fourth group. This term desig­nates samples selected strictly in terms of the opportunities available to the researcher, without applying any particular criteria of choice. This selection method does not allow for statistical inference. Nor does it guarantee the possi­bility of theoretical inference, although an ex post analysis of the composition of the sample may sometimes allow it. For this reason, convenience sampling is generally used in exploratory phases only, the purpose being to prepare for the next step, rather than to draw conclusions. In this context a convenience sample can be sufficient, and it does present the advantage of facilitating and accelera­ting the process of data collection.

The choice of methods is often restricted by economic reasons and reasons of feasibility. Nonetheless, the final decision in favor of a particular method must always be based on the objectives of the study.

1.1. Probability sampling

Probability sampling involves selecting elements randomly – following a random procedure. This means that the selection of any one element is independent of the selection of the other elements. When trying to estimate the value of a certain parameter or indicator, probability samples allow researchers to calculate how precise their estimations are. This possibility is one advantage of probability sampling over other selection methods.

Two elements distinguish among different types of probability sampling methods:

  • The characteristics of the sampling frame: whether the population is com­prehensive or not and whether the frame includes specific information for each population element.
  • The degree of precision of the results for a given sample size.

Simple random sampling Simple random sampling is the most basic selection method. Each element of the population has the same probability of being selected into the sample – this is referred to as equal probability selection. The elements of the sampling frame are numbered serially from 1 to N, and a table of random numbers is used to select them.

The main disadvantage of simple random sampling is that a comprehensive, numbered list of the population is required. This method also tends to select geographically diverse elements, which can make data collection extremely costly.

Systematic sampling Systematic sampling is closely related to simple random sampling. Its main advantage is that it does not require a numbered list of the population elements. A systematic selection process selects the first element randomly from the sampling frame, then selects the following elements at con­stant intervals. The selection interval is inversely proportional to the sampling ratio of sample size n divided by population size N. For example, if the samp­ling ratio is 1/100, one element will be selected in the list every 100 elements. Nevertheless, it is important to ensure that the selection interval does not corres­pond to an external reality that could bias the outcome. For example, if the sampling frame supplies monthly data in chronological order and the selection interval is a multiple of 12, all the data collected will refer to the same month of the year.

In practice, this procedure is not always followed strictly. Instead of setting a selection interval in terms of the number of elements, a simple rule is often established to approach this interval. For example, if the sampling frame is a professional directory, and the selection interval corresponds to approximately three pages in the directory, an element will be selected every three pages: the fifth element on the page – for instance – if the first, randomly selected, element was in that position.

Stratified sampling In stratified sampling, the population is initially segmen­ted on the basis of one or more pre-established criteria. The method is based on the hypothesis that there is a correlation between the phenomenon under observation and the criteria chosen for segmenting the population. The aim is to create strata that are as homogenous as possible in terms of the variable in question. The precision of the estimates is greatest when the elements are homo­genous within each stratum and heterogeneous from one stratum to the other. Consequently, in order to choose useful segmentation criteria the researcher must have a reasonably good prior knowledge of both the population and the phenomenon under study. This can be achieved by, for example, examining the results of earlier research.

Sample elements will then be selected randomly within each stratum, according to the sampling ratio, which may or may not be proportional to the relative number of elements in each stratum. When sample size is identical, using a higher sampling ratio for strata with higher variance – to the detriment of the more homogenous strata – will reduce the standard deviation for the whole sample, thereby making the results more precise. A higher sampling ratio might also be used for a subset of the population that requires closer study.

Multistage sampling Multistage sampling makes repeated selections at dif­ferent levels. The first stage corresponds to the selection of elements called pri­mary units. At the second stage, subsets, called secondary units, are randomly selected from within each primary unit, and the procedure is repeated until the final stage. Elements selected at the final stage correspond to the units of analysis. One significant advantage of multistage sampling is that it does not require a list of all of the population elements. Also, when stages are defined using geo­graphical criteria, the proximity of the selected elements will, in comparison with simple random sampling, reduce the costs of data collection. The down­side of this method is that the estimates are less precise.

In multistage sampling it is entirely possible to choose primary units accord­ing to external criteria – in particular, to reduce data collection costs. This prac­tice does not transgress the rules of sampling. In fact, the only thing that matters is the equal probability selection of the elements in the final stage. The sampling ratio for the subsequent stages should however be lower, to compensate for the initial choice of primary unit.

Cluster sampling Cluster sampling is a particular type of two-stage sampling. The elements are not selected one by one, but by subsets known as clusters, each element of the population belonging to one and only one cluster. At the first stage, clusters are selected randomly. At the second, all elements of the selected clusters are included in the sample.

This method is not very demanding in terms of the sampling frame: a list of clusters is all that is required. Another important advantage is the reduction in data collection costs if the clusters are defined by a geographic criterion. The downside is that estimates are less precise. The efficiency of cluster sampling depends on the qualities of the clusters: the smaller and more evenly sized they are, and the more heterogeneous in terms of the studied phenomenon, the more efficient the sample will be.

We should make it clear that these different sampling methods are not necessarily mutually exclusive. For instance, depending on the purposes of the study, multistage sampling might be combined with stratified sampling, the primary units being selected at random and the elements of the sample being selected into the primary units by the stratification method. One can also, for example, stratify a population, and then select clusters of elements within each stratum. This type of combination can raise the precision level of the estimations, while at the same time taking practical constraints into account (whether or not a comprehensive sampling frame exists, the available budget, etc.). Table 8.1 presents the advantages and disadvantages of each of these probability sampling methods.

1.2. Judgement sampling

The subjectivity of judgement sampling differentiates it from probability samp­ling, whose very purpose is to eliminate subjectivity. In management research, judgement samples, whether intended for qualitative or quantitative process­ing, are much more common than probability samples.

Unlike probability sampling, neither a specific procedure nor a sampling frame is needed to put together a judgement sample – as pre-existing sampling frames for organizational phenomena are rare, this is a definite advantage.

Even if it were theoretically possible to create one, the difficulty and the cost involved would often rule it out, although in some cases the snowball tech­nique can provide a solution (Henry, 1990). In addition, probability sampling is not always necessary, as research is often aimed more at establishing or testing a proposition than at generalizing results to a given population. For small samples, judgement sampling gives results that are just as good as those obtained from probability sampling, since the variability of the estimates for a small random sample is so high that it creates a bias equally great or greater than that result­ing from subjective judgement (Kalton, 1983). Furthermore, a sensitive research subject or an elaborate data collection system can bring about such elevated refusal rates that probability sampling does not make sense. Judgement sampling also allows sample elements to be selected extremely precisely, making it easier to guarantee respect for criteria such as homogeneity, which is required by certain research designs.

Judgement sampling does follow certain theoretical criteria, and to carry it out properly, the researcher must have a good working knowledge of the popu­lation being studied. The most common criterion is how ‘typical’, or conversely, ‘atypical’, the element is. Typical elements are those the researcher considers to be particularly ‘normal’ or ‘usual’ (Henry, 1990) in the population. A second criteria is the relative similarity or dissimilarity of the elements selected.

For both qualitative and quantitative research, selection criteria are guided by the desire to create either a homogenous or a heterogeneous sample. A homogenous sample will make it easier to highlight relationships and build theories. To put together such a sample, similar elements must be selected and atypical ones excluded. When research presenting strong internal validity has enabled a theory to be established, the results may be able to be generalized to a larger or a different population. In order to do this, dissimilar elements must be selected. For example, to increase the scope of a theory, Glaser and Strauss recommend varying the research field in terms of organizations, regions, and/or nations (Glaser and Strauss, 1967).

In experiments aimed at testing a relationship when it is difficult to select ran­dom samples large enough to provide significant external validity, one solution is to use samples composed of deliberately dissimilar elements (Cook and Campbell, 1979). The inference principle is as follows: as heterogeneity exercises a negative influence on the significance of the effect, if the relation appears significant despite this drawback, then the results can be generalized further.

1.3. Quota sampling

Quota sampling is a non-random sampling method that allows us to obtain a relatively representative sample of a population. There are a number of reasons for choosing quota sampling, for example, when the sampling frame is not available or is not detailed enough, or because of economical considerations.

As in stratified sampling, the population is segmented in terms of predefined criteria, in such a way that each member of the population belongs to one and only one segment. Each segment has a corresponding quota, which indicates the number of responses to be obtained. The difference between these two methods is found in the means of selecting sample elements, which in the quota method is not random. Two different types of procedures can be used.

The first type of procedure consists of filling the quotas as opportunities present themselves. The risk in this instance is that the sample might contain selection biases, since the first elements encountered may present a particular profile depending, for example, on the interviewer’s location, the sampling frame or other reasons.

The second type of procedure is called pseudo-random. For this a list of popu­lation elements (for example, a professional directory) is required, although, unlike stratified sampling, segmentation criteria are not needed for this list. The selection procedure consists of selecting the first element of the list at random, then going through the list systematically until the desired number of answers is reached. Even though this method does not scrupulously respect the rules of random sampling (the researcher does not know in advance the probability an element has of belonging to the sample), it does reduce potential selection bias by limiting subjectivity. Empirical studies have shown that the results are not significantly different from those obtained using probability sampling (Sudman, 1976).

2. Matched Samples

Experimental designs often use matched samples. Matched samples present similar characteristics in terms of certain relevant criteria. They are used to ascertain that the measured effect is a result of the variable or variables studied and not from differences in sample composition.

There are two principal methods of matching samples. The most common is randomization, which divides the initial sample into a certain number of groups (equal to the number of different observation conditions) and then ran­domly allocates the sample elements into these groups. Systematic sampling is often used to do this. For example, if the researcher wants to have two groups of individuals, the first available person will be assigned to the first group, the second to the second, the third to the first, etc. When the elements are hetero­geneous, this randomization technique cannot totally guarantee that the groups will be similar, because of the random assignment of the elements.

The second method consists of controlling sample structure beforehand. The population is stratified on the basis of criteria likely to affect the observed vari­able. Samples are then assembled so as to obtain identical structures. If the samples are large enough, this method has the advantage of allowing data processing to be carried out within each stratum, to show up possible strata differences.

According to Cook and Campbell (1979), matching elements before randomi­zation is the best way of reducing error that can result from differences in sam­ple composition. The researcher performs a pre-test on the initial sample, to measure the observed variable for each sample element. Elements are then classified from highest to lowest, or vice versa, in terms of this variable, and the sample is divided into as many equally sized parts as there are experimental conditions. For example, if there are four experimental conditions, the four elements with the highest score constitute the first part, the next four the second, etc. The elements in each part are then randomly assigned to experimental con­ditions. The four elements of the first part would be randomly assigned to the four experimental conditions, as would the four elements of the second part, and so on.

3. Sample Biases

Sample biases can affect both the internal and the external validity of a study. There are three categories of biases: sampling variability, sampling bias and non-sampling bias (although sampling variability and estimator’s bias affect probability samples only). The sum of these three biases is called the total error of the study (see Figure 8.2).

Sampling variability refers to differences that can be observed by comparing samples. Although one starts with the same population, samples will be com­posed of different elements. These differences will reappear in the results, which can, therefore, vary from one sample to another. Sampling variability decreases when sample size increases.

Sampling bias is related to the process of selecting sample elements or to the use of a biased estimator. In the case of a random sampling method, selection bias can crop up every time random selection conditions are not respected. Nevertheless, selection bias is much more common in non-random sampling, because it is impossible, by definition, for these methods to control the proba­bility that an element is selected into the sample. For example, quota sampling can lead to significant selection bias insofar as the respondents are, rather sub­jectively, selected by the investigator. Other sampling biases are related to the estimator selected. An estimator is a statistical tool that enables us to obtain, thanks to the data gathered from a sample, an estimate for an unknown para­meter, for example, variance. The mathematical construction of certain esti­mators presents the ‘proper’ properties, which establish the ‘proper’ estimates directly. When this is not the case, we say the estimator is biased.

Biases that are not related to sampling can be of different types, usually divided into two categories: non-observation biases and observation biases. The first can arise either from problems in identifying the study population, which we call coverage bias, or from lack of response. They can affect samples inten­ded for qualitative or quantitative processing. Observation biases, on the other hand, are associated with respondent error, or data-measurement, -recording or -encoding errors. Since observation biases do not stem from the constitution of the sample per se, in the following discussion we will consider non-observation- related biases only.

3.1. Non-coverage bias

A sample presents non-coverage bias when the study population does not corres­pond to the intended population, which the researcher wishes to generalize the results to. The intended population can encompass individuals, organizations, places or phenomena. It is often defined generically: researchers might say they are studying ‘small businesses’ or ‘crisis management’, for example. But researchers must take care to establish criteria that enable the population to be precisely identified. The set defined by the operationalization criteria will then constitute the study population. Two types of error can lead to a less than perfect correspondence between the intended population and the population under study: population-definition errors and listing errors.

Errors in defining the study population are one major source of bias. Inappropriately defined or insufficiently precise operationalization criteria can lead researchers to define the study population too broadly, or conversely, too narrowly. This type of error, for example, can result in different companies being selected for the same intended population. Not all of the sets defined in this way are necessarily pertinent in terms of the question being studied and the purpose of the research. This type of bias can occur in any type of sampling.

Example: Sources of error in defining the population

In a study of strategic choice in small businesses, the set ‘small businesses’ corres­ponds to the intended population. Nevertheless, it is important to establish criteria for defining an organization as a ‘small business’. Sales figures or the number of employees are two possible operationalization of the qualifier ‘small’. Similarly, ‘businesses’ could be defined in broad terms – as all organizations belonging to the commercial sector – or more restrictively – in terms of their legal status, including only incorporated organizations, and excluding non-profit and economic-interest groups. Choosing an overly strict operationalization of the definition, and including incorporated companies only, for example, will result in a sample that is not truly representative of the small business set. Partnerships, for example, would be exclu­ded, which could create a bias.

Listing errors are a potential cause of bias in the case of probability samples, for which the study population has been materialized as a sampling frame. They often result from recording errors or, even more commonly, from the insta­bility of the population being observed. For example, a professional directory published in 2000, used in the course of the following year will include com­panies that no longer exist and, conversely, will not include those which have been created since the directory was published. For practical reasons, it is not always possible to be rid of these errors. And yet, the validity of a study depends on the quality of the sampling frame. Researchers should therefore make sure that all the elements in the intended population are on the list, and that all the elements that do not belong to the population are excluded from it. The measures used to increase the reliability of the sampling frame can sometimes be ambiva­lent. For example, cross-referencing several lists generally helps to reduce the number of missing elements, but it can also lead to including the same element more than once, or to including elements that do not belong to the intended population. In the first case, the conditions of equal probability for each element are no longer maintained. In the second, bias appears which is comparable to the one presented above for definition error. Researchers can reduce these different types of errors before the sample is selected by scrupulously checking the sampling frame.

3.2. Non-response bias

Non-response bias can have two sources: the refusal of elements to participate in the study, or the impossibility of contacting a selected element or elements. If non-responses are not distributed randomly, the results can be biased. This is the case when non-response is connected to characteristics related to the study. For example, for research studying the effect of incentive programs on manage­rial behavior, non-response may correlate to a certain type of behavior (for example, interventionist) or with certain categories of incentive (for example, stock-option programs).

The higher the non-response rate, the greater the bias may be and the more likely it is to affect the validity of the research. The researcher should therefore try to avoid non-response. Several inducement techniques can be used for this purpose, generally dealing with methods to use when contacting and following up respondents, or with maintaining contact (this subject is dealt with in greater depth in Chapter 9). While these efforts may reduce the non-response rate, they rarely result in the researcher obtaining responses for the entire set of selected elements.

Different techniques can be applied to analyze non-response and, in certain circumstances, correct any possible bias of probability sampling results. These are presented at the end of this chapter, in the section on post sampling.

Because of non-coverage and non-response biases, the observed population hardly ever matches the intended population perfectly. But this does not pre­vent the researcher from attempting to achieve this goal, as these biases can threaten the validity of the research.

Source: Thietart Raymond-Alain et al. (2001), Doing Management Research: A Comprehensive Guide, SAGE Publications Ltd; 1 edition.

Determining Research Sample Size

Determining the size of a sample really comes down to estimating the mini­mum size needed to obtain results with an acceptable degree of confidence. For samples destined for quantitative data processing this means determining the size that enables the study to attain the desired degree of precision or signi­ficance level; for qualitative research it is the size that confers an acceptable credibility level.

As a general rule, and all else being equal, the larger the sample, the greater the confidence in the results, whatever type of data processing is used. However, large samples pose problems of practicality, particularly in terms of cost and scheduling. Beyond a certain size, they can also pose problems in terms of relia­bility, for when a sample is very large, the researcher is often required to farm out data collection. This can increase the number of collection, recording and encoding errors – and may require the instigation of sometimes elaborate veri­fication procedures. Large samples can also turn out to be unnecessarily costly. For example, a small sample is sometimes sufficient to obtain a significant result when the effect of a variable in an experimental design has to be tested.

Determining the appropriate sample size before collecting data is essential in order to avoid the ex post realization that a sample is too small. Calculating the sample size required involves evaluating the feasibility of the research’s objectives, and, in certain cases, can lead to modifying the research design.

1. Samples Intended for Quantitative Processing

The size required for a sample intended for quantitative data processing depends on the statistical method used. Our intention here is not to provide formulae, but simply to present the factors common to most methods that influ­ence the sample size needed. There are many such factors: the significance level, the desired level of precision, the variance of the studied phenomenon in the population, the sampling technique chosen, the size of the effect being studied, the desired power of the test and the number of parameters to estimate. Which ones need to be taken into consideration depend on the purposes of the study. Nevertheless, two main categories of objectives can be distinguished: describing a population and testing a hypothesis.

1.1. Descriptive research

The principal evaluation criterion for descriptive research is usually precision. Precision depends on several factors: the desired significance level, the popu­lation variance and the sampling technique used. To illustrate the incidence of these factors on sample size, we will consider a very familiar statistic: the mean.

Example: Calculating sample size to estimate a mean

In the case of a simple random sample of more than 30 elements selected with or without replacement, but with a sampling ratio smaller than 10 per cent, to reach the desired level of precision, the minimum sample size is

where l is the level of precision, s is the population’s standard deviation, ■ the sample size, and z the value of the normal distribution for the significance level.

Population variance and sample size The larger the variance s2, the larger the sample needs to be. Very often, however, the variance of the population is unknown. In that case, it must be estimated in order to calculate the size of the sample. There are several possible ways of doing this. The first is to use results of earlier studies that give suggested variance estimates. Another solution is to perform a pilot study on a small sample. The variance calculated for this sam­ple will provide an estimate for the population variance. A third solution is based on the assumption that the variable being studied follows a normal dis­tribution, which is unlikely for many organizational phenomena. Under this assumption, the standard deviation is approximately one-sixth of the distribu­tion range (maximum value minus minimum value). Finally, when a scale is used to measure the variable, one can refer to the guidelines below.

Significance level and sample size Significance level (a) refers to the possibil­ity of rejecting the null hypothesis when it should not have been rejected. By convention, in management research accepted levels are generally from 1 per cent to 5 per cent, or as much as 10 per cent – depending on the type of research. The 1 per cent level is standard for laboratory experiments; for data obtained through fieldwork, 10 per cent could be acceptable. If the significance level is above 10 per cent, results are not considered valid in statistical terms. The desired significance level (a) has a direct influence on sample size: the lower the accept­able percentage of error, the larger the sample needs to be.

Precision level and sample size The precision level (l) of an estimate is given by the range of the confidence interval. The more precise the results need to be, the larger the sample must be. Precision is costly. To increase it twofold, sample size must be increased fourfold.

Sampling method and sample size The sampling method used affects samp­ling variability. Every sampling method involves a specific way of calculating the sample mean and standard deviation (for example, see Kalton, 1983). Consequently, sample size cannot always be calculated with the simple formula used in the example on page 158, which is valid for a simple random sample only. However, no matter which sampling method is chosen, it is possible to estimate sample size without having to resort to complex formulae. Approxi­mations can be used. Henry (1990), for example, presents several ‘design effect’ – or deff – adjustment coefficients (see Table 8.3).

By applying these coefficients, sample size can be estimated with a simple calculation derived from the basic formula. The variance is multiplied by the coefficient corresponding to the method used (s’2 = s2. deff).

Returning to the formula we used above, with a simple random sample the size is:


With a multistage sample, the maximum deff coefficient is 1.5, so the size is:

1.2. Hypothesis testing

Other criteria must also be taken into account in the case of samples that will be used to test hypotheses (the most common use of samples in research work). These include effect size, the power of the statistical test and the number of parameters to estimate. These criteria help us to ascertain the significance of the results.

Effect size and sample size Effect size describes the magnitude or the strength of the association between two variables. Indices measuring effect size depend on the statistics used.

If we take, for example, the test of difference between means, and we assume that the standard deviation is the same for both samples, effect size is given by the ratio d:

For example, if the average y1of the studied variable in the first sample is 33, the mean y2 of the second is 28, and the standard deviation s is 10 for each sample, the effect size will be 50 per cent (d = (33 – 28)/10 = 0.5).

Effect sizes are generally classified into three categories: small, medium and large. A 20 per cent effect is considered small, a 50 per cent effect medium and an 80 per cent effect large (Cohen, 1988). In terms of proportion of variance, accounted for by an independent variable, these three categories correspond to the values 1 per cent, 6 per cent and 14 per cent.

The smaller the effect the larger the sample size must be if it is to be statistically significant. For example, in a test of difference between means, with two identically sized samples, if the required size of each sample is 20 for a large effect, it will be 50 for a medium one and 310 for a small effect, all else being equal.

Estimating effect size is not easy. As for variance, we can use estimates from earlier research or do a pilot study with a small sample. If no estimate exists, we can also use the minimum effect size that we wish to obtain. For example, if an effect of less than 1 per cent is deemed worthless, then sample size must be calculated with an effect size of 1 per cent.

For management research effect sizes are usually small, as in all the social sciences. When analyzing 102 studies about personality, Sarason et al. (1975) noticed that the median percentage of variance accounted for by an indepen­dent variable ranged from 1 per cent to 4.5 per cent depending on the nature of the variable (demographics, personality or situation).

The power of the test and sample size The power of the test could be interpreted as the likelihood of being able to identify the studied effect. When it is low, we cannot determine whether there is no relation between the vari­ables in the population, or whether a relation exists but was not significant because the research was not sufficiently sensitive to it.

The power of the test is expressed with the coefficient (1 – β) (see Chapter 11, Comparison Tests).

For example, a power of 25 per cent (1 -β = 0.25) means that there is only a 25 per cent chance of correctly rejecting the null hypothesis H0: that is, there is a 75 per cent chance that no conclusion will be drawn.

The power of the test is rarely mentioned when presenting results, and is not often considered in management sciences (Mazen et al., 1987). Most research presents significant effects only, i.e. for which the null hypothesis H0 has been able to be rejected. In this case, the decision error is the Type I error a. So it is not surprising to see that Type II error P is not mentioned, since it means accept­ing H0 when it is not true.

Cohen (1988) defined standards for β error of 20 per cent and 10 per cent. They are not as strict as those generally accepted for significance level α (5 per cent and 1 per cent). The power of the test depends on the significance level. The relationship between a and β is complex, but, all else being equal, the lower a is, the higher β becomes. Still, it is not advisable to reduce Type II error by increasing Type I error, because of the weight of convention concerning α error. There are other means of improving power. For a given a error, the power of the test increases when sample size increases and variance decreases. If, despite everything, the power of the test is still not acceptable, it may be reasonable to give up on the test in question.

In research comparing two samples, increasing the size of one of them (the control sample) is another way of increasing the power of the test.

When replicating research that did not lead to a rejection of the null hypo­thesis, Sawyer and Ball (1981) suggest estimating the power of the tests that were carried out – this can be calculated through the results of the research. If
the power appears low, it should be increased in order to raise the chance of obtaining significant results. Cook and Campbell (1979) also advise presenting the power of the test in the results when the major research conclusion is that one variable does not lead to another.

Sample size and number of parameters to estimate Sample size also depends on the number of parameters to be estimated, that is, the number of variables and interaction effects which are to be studied. For any statistical method, the larger the number of parameters that are to be estimated, the larger the sample should be.

When more elaborate statistical methods are used, determining the sample size required in order to achieve the desired significance becomes extremely complex. For means and proportions, simple calculation formulae exist and can be found in any statistics handbook (for example, see Thompson, 1992). On the other hand, for more complicated methods, for example, regression, there are no simple, comprehensive formulae. Researchers often imitate earlier studies for this reason. For most methods, however, calculation formulae or tables exist which enable researchers to estimate sample size for one or more criteria. Rules of thumb often exist as well. These are not, of course, as precise as a formula or a table, but they may be used to avoid major mistakes in estimating sample size.

1.3. Usable sample size

The indications presented above for determining sample size concern only the usable sample size – that is, the number of elements retained for statistical analysis. In a random sampling technique, each element selected should be part of the usable sample. If that is not the case, as we mentioned in the first section, then there is bias. It is unusual in management research, though, to obtain all the desired information from each of the randomly selected elements. The rea­sons for this are many, but they can be classified into four main categories: impossibility of contacting a respondent, refusal to cooperate, ineligibility (that
is, the selected element turns out not to belong to the target population) and responses that are unusable (for example, due to incompleteness). The response rate can vary tremendously, depending on a great number of factors related to the data collection methods used (sampling method, questionnaire adminis­tration technique, method used to contact respondents, etc.), the nature of the information requested or the amount of time required to supply it. The response rate can often be very low, particularly when data is being gathered through self-administered questionnaires. Certain organizational characteristics can also affect the response rate. The respondent’s capacity and motivation can similarly depend on organizational factors (Tomaskovic-Devey et al., 1994). For example, when a questionnaire is addressed to a subsidiary, but decision-making is cen­tralized at the parent company, response probability is lower.

The likely response rate must be taken into account when determining the size of the sample to be contacted. Researchers commonly turn to others who have collected similar data in the same domain when estimating this response rate.

Samples used in longitudinal studies raise an additional problem: subject attrition – that is, the disappearance of certain elements (also referred to as sample mortality). In this type of study, data is gathered several times from the same sample. It is not unusual for elements to disappear before the data collec­tion process is complete. For example, when studying corporations, some may go bankrupt, others may choose to cease cooperating because of a change in management. In researching longitudinal studies published in journals of indus­trial psychology and organizational behavior, Goodman and Blum (1996) found attrition rates varied from 0 to 88 per cent with a median rate of 27 per cent. In general, the longer the overall data-collection period, the higher the attrition rate. Researchers should always take the attrition rate into account when calcu­lating the number of respondents to include in the initial sample.

1.4. Trading-off sample size and research design

As discussed above, sample size depends on the variance of the variable under study. The more heterogeneous the elements of the sample are, the higher the variance and the larger the sample must be. But it is not always feasible, nor even necessarily desirable, to use a very large sample. One possible answer to this problem is to reduce variance by selecting homogenous elements from a subset of the population. This makes it possible to obtain significant results at lower cost. The drawback to this solution is that it entails a decrease in external validity. This limitation is not, however, necessarily a problem. Indeed, for many studies, external validity is secondary, as researchers are more concerned with establishing the internal validity of results before attempting to generalize from them.

When testing hypotheses, researchers can use several small homogenous samples instead of a single, large heterogeneous sample (Cook and Campbell, 1979). In this case, the approach follows a logic of replication. The researcher tests the hypothesis on one small, homogenous sample, then repeats the same analysis on other small samples, each sample presenting different characteristics. To obtain the desired external validity, at least one dimension, such as popula­tion or place, must vary from one sample to another. This process leads to a high external validity – although this is not a result of generalizing to a target population through statistical inference, but rather of applying the principles of analytic generalization across various populations. The smaller samples can be assembled without applying the rigorous sampling methods required for large, representative samples (Cook and Campbell, 1979). This process also offers the advantage of reducing risks for the researcher, in terms of time and cost. By limi­ting the initial study to a small, homogenous sample, the process is simpler in its application. If the research does not produce significant results, the test can be performed on a new sample with a new design to improve its efficiency. If that is not an option, the research may be abandoned, and will have wasted less labor and expense than a test on a large, heterogeneous sample.

A similar process using several small samples is also an option for researchers studying several relations. In this case the researcher can test one or two variables on smaller samples, instead of testing all of them on a single large sample. The drawback of this solution, however, is that it does not allow for testing the inter­action effect among all the variables.

2. Samples Intended for Qualitative Analysis

In qualitative research, single-case studies are generally differentiated from multiple-case studies. In fact, single case studies are one of the particularities of qualitative research. Like quantitative hypothesis testing, sample size for quali­tative analysis also depends on the desired objective.

2.1. Single case studies

The status of single-case studies is the object of some controversy. Some writers consider the knowledge acquired from single case studies to be idiosyncratic, and argue that it cannot be generalized to a larger or different population. Others dispute this: for example, Pondy and Mitroff (1979) believe it to be per­fectly reasonable to build theory from a single case, and that the single-case study can be a valid source for scientific generalization across organizations. According to Yin (1990), a single-case study can be assimilated to an experi­ment, and the reasons for studying a single case are the same as those that motivate an experiment. Yin argues that single case studies are primarily justi­fied in three situations. The first is when testing an existing theory, whether the goal is to confirm, challenge or extend it. For example, Ross and Straw (1993) tested an existing prototype of escalation of commitment by studying a single case, the Shoreham nuclear-power plant. Single cases can also be used when they have unique or extreme characteristics. The singularity of the case is then the direct outcome of the rarity of the phenomenon being studied. This was the case, for example, when Vaughan (1990) studied the Challenger shuttle disas­ter. And finally, the single-case study is also pertinent if it can reveal a pheno­menon which is not rare but which had until now been inaccessible to the scientific community. Yin points to Whyte’s (1944) research in the Italian com­munity in poor areas of Boston as a famous example of this situation.

2.2. Multiple cases

Like quantitative analysis, the confidence accorded to the results of qualitative research tends to increase with sample size. The drawback is a parallel increase in the time and cost of collecting data. Consequently, the question of sample size is similar to quantitative samples – the goal is to determine the minimum size that will enable a satisfactory level of confidence in the results. There are essentially two different principles for defining the size of a sample: replica­tion and saturation. While these two principles are generally presented for determining the number of cases to study, they can also be applied to respondent samples.

Replication The replication logic in qualitative research is analogous to that of multiple experiments, with each case study corresponding to one experiment (Yin, 1990). The number of cases required for research depends on two criteria, similar to those existing for quantitative samples intended for hypothesis test­ing. They are the desired degree of certainty and the magnitude of the observed differences.

There are two criteria for selecting cases. Each case is selected either because similar results are expected (literal replication) or because it will most likely lead to different results for predictable reasons (theoretical replication). The number of cases of literal replication required depends on the scale of the observed differences and the desired degree of certainty. According to Yin (1990), two or three cases are enough when the rival theories are glaringly different or the issue at hand does not demand a high degree of certainty. In other circumstances, when the differences are subtle or the required degree of certainty is higher, at least five or six literal replications would be required.

The number of cases of theoretical replication depends on the number of conditions expected to affect the phenomenon being studied. As the number of conditions increases, so does the potential number of theoretical replications. To compare it to experimentation, these conditions of theoretical replication in multiple case studies fulfill the same purpose as the different conditions of observation in experimental designs. They increase the internal validity of the research.

The saturation principle Unlike Yin (1990), Glaser and Strauss (1967) do not supply an indication for the number of observation units a sample should contain. According to these authors, the adequate sample size is determined by theoretical saturation. Theoretical saturation is reached when no more information will enable the theory to be enriched. Consequently, it is impossible to know in advance what the required number of observation units will be.

This principle can be difficult to apply, as one never knows with absolute certainty if any more information that could enrich the theory exists. It is up to the researcher therefore, to judge when the saturation stage has been reached. Data collection usually ends when the units of observation analyzed fail to supply any new elements. This principle is based on the law of diminishing returns – the idea that each additional unit of information will supply slightly less new information than the preceding one, until the new information dwindles to nothing.

Above and beyond these two essential principles, whose goal is raising internal validity, it is also possible to increase the number of cases in order to improve external validity. These new cases will then be selected in such a way as to vary the context of observation (for example, geographical location, industrial sector, etc.). Researchers can also take the standard criteria of credibility for the community to which they belong into account when determining the number of elements to include in a sample intended for qualitative processing.

Source: Thietart Raymond-Alain et al. (2001), Doing Management Research: A Comprehensive Guide, SAGE Publications Ltd; 1 edition.

The Sample Selection Process

Sample selection can follow a number of different procedures, many of which are related to two generic approaches: the traditional approach, typical of proba­bility sampling, and the iterative approach, such as that applied for grounded theory (Glaser and Strauss, 1967). The sample selection process also includes certain procedures that are carried out after data has been collected.

1. Two Standard Approaches

The traditional approach (see Figure 8.3) is typical of probability sampling, but it is also frequently encountered in the quota method. It starts by defining the target population, for which the results will be generalized through statistical inference. The population is operationalized in order to have clear criteria to determine the elements included in or excluded from the study population. The next step is to select a sampling method. It then becomes possible to determine the sample size. If a random sampling method is used, it will be necessary to choose or create a sampling frame in order to carry out random selection. The researcher then selects the sample elements and collects the required data. The elements for which all of the required data could in fact be collected constitute the study’s ‘usable’ sample. The last stage of this procedure is a study of poten­tial biases and, if necessary, adjustment to the sample.

Each stage of this process (sampling method, sample size and element- selection techniques) being related, the outcome of one stage can lead to a reconsideration of earlier choices (Henry, 1990). For example, if the required sample size is too large in terms of the cost of data collection, the population can sometimes be narrowed to make the sample more homogenous. The significance level required for internal validity is then easier to achieve. If it turns out to be difficult to establish or find a sampling frame, another sampling method might be chosen. Consequently, the choices related to selecting a sample often follow a non-linear process (Henry, 1990).

An iterative approach follows a radically different process. Unlike the classic approach, the scope of generalization for the results is not defined at the outset, but rather at the end of the process. Another important difference between the two procedures lies in the progressive constitution of the sample by successive iterations. Each element of the sample is selected by judgement. The data are then collected and analyzed before the next element is selected. Over the course of successive selections, Glaser and Strauss (1967) suggest first studying simi­lar units in order to enable the emergence of a substantive theory before enlarg­ing the collection to include units with different characteristics. The process is completed when theoretical saturation is reached. Unlike the classic procedure, the size and composition of the sample are not predetermined but, quite the opposite, they arise from the outcome of the iterative process of successive selection of elements. These choices are guided by both the data collected and the theory being elaborated. The scope of generalization of the results is constructed progressively over the course of the procedure and is defined only at the outcome of the process.

Role of the pre-test in the sample selection process In practice, research often involves a phase of pre-testing. This pre-testing does not specifically concern sampling, but it does supply useful information that can contribute to a better definition of the required size and composition of the final sample. In quanti­tative studies, the pre-test sample can, in particular, provide an initial estimate for variance and aid in identifying criteria for segmenting a stratified sample. In qualitative research, the pilot case aids in determining the composition and number of cases required. These factors depend on literal and theoretical repli­cation conditions and the magnitude of observed differences (Yin, 1990).

2. Specific Approaches

2.1. Progressive sample selection

The traditional approach is to determine sample size before data collection. However, another possible approach is to collect and process data until the desired degree of precision or level of significance is reached. This involves successive rounds of data collection (Thompson, 1992). According to Adlfinger (1981), this procedure allows us to arrive at a sample half the size it would have been had we determined it in advance. Establishing a minimal size in advance does generally lead to oversized samples as, to be on the safe side, researchers often work from the most pessimistic estimates.

Unfortunately though, researchers are not always in a position to employ this procedure, which can reduce data-collection costs considerably. A study attempting to analyze the impact of a non-reproducible event (such as a merger between two companies) on a variable (for example, executive motivation) illus­trates this. Such a study requires data to be collected both before and after the event – it is not possible to increase the number of elements in the sample progressively. The researcher is then obliged to follow the classic procedure – and to determine sample size in advance.

Even if it were possible to constitute the sample progressively, it would still be worthwhile to estimate its size in advance. Without a prior estimate, the researcher runs the risk of not being able to enlarge the sample (for example, for budgetary concerns). The sample might well turn out to be too small to reach the desired significance level.

Determining sample size beforehand enables researchers to evaluate the feasi­bility of their objectives. This is one way we can avoid wasting time and effort on unsatisfactory research, and it encourages us to consider other research designs that might lead to more significant results.

2.2. Ex post selection

For laboratory experiments, matched samples are constructed by selecting elements, dividing them randomly into the different treatment conditions and collecting data on them. Yet not all phenomena lend themselves to constituting matched samples before data collection. Sample structure can be hard to master, particularly when studying phenomena in real settings, when the phenomena are difficult to access or to identify, or when the population under study is not well known. In these situations, it is sometimes possible to constitute matched samples after data collection – ex post – in order to perform a test. To do this, a control group is selected from the target population following the rules of random selection, in such a way that the structure of the control group reproduces that of the observed group.

3. Post-sampling

3.1. Control and adjustment procedures

It is often possible ex post to correct non-sampling biases such as non-response and response errors. But researchers should bear in mind that adjusting data is a fall-back solution, and it is always preferable to aim to avoid bias.

Non-response Non-responses can cause representativeness biases in the sample. To detect this type of bias, the researcher can compare the structure of the respondent sample to that of the population, focusing on variables that might affect the phenomenon being studied. If these structures differ noticeably, rep­resentativeness bias is probable, and should be corrected.

There are three ways of correcting non-response biases. The first is to survey a subsample of randomly selected non-respondents. The researcher must then make every effort to obtain a response from all of the elements in this subsample (Lessler and Kalsbeek, 1992). The second is to perform an ex post stratification, in which responses from sample elements are weighted to reconstruct the structure of the population (Lessler and Kalsbeek, 1992). This method can also be employed in two other situations of non-response bias: when stratification has not been carried out in advance because of technical difficulties (for example, if no sampling frame, or only an insufficiently precise one, was available), or when a new stratification variable is discovered belatedly, during the data analysis phase. In any case, ex post stratification can increase the precision of estimations. The third procedure is to replace non-respondents with new respondents pre­senting identical characteristics, and to compensate by assigning the new res­pondents a weighted factor (Levy and Lemeshow, 1991). This method can also be applied to adjust for missing responses when replies are incomplete.

If data for certain identifiable subsets of the sample is still missing at the end of this process, the population should be redefined – or, at the very least, this weakness in the study should be indicated.

Response error Response errors can be checked by cross-surveying a sub-set of respondents (Levy and Lemeshow, 1991). This may identify certain types of error, such as errors derived from the interviewer or from respondents misunderstanding the question (although this method is futile if respondents willfully supply erroneous information, which is extremely difficult to detect or correct).

3.2. Small samples

Despite taking all precautions, a sample sometimes turns out to have been too small to obtain the precision or the significance level desired. In this case, the best solution is to carry out a second round of data collection that will enlarge the sample. But this is not always an option (for example, when secondary data is used, when the sampling frame has been entirely exploited, or when the data depend on a particular context which has changed).

When the sample size cannot be increased, the researcher can compensate by generating several samples from the original one. The two main ways of doing this are known as the ‘jackknife’ and the ‘bootstrap’ (Mooney and Duval, 1993). These methods enable researchers to establish their results more firmly than they could through standard techniques alone.

The jackknife The jackknife creates new samples by systematically removing one element from the initial sample. For a sample size of n, the jackknife gives n samples of size n – 1. Statistical processing is then carried out on each of these samples, and the results are compared to the initial sample. The more the results converge, the greater the confidence with which we can regard the outcome.

The bootstrap The bootstrap works on a relatively similar principle, but the samples are constituted differently. They are obtained by random sampling with replacement from the initial sample, and they contain the same number of elements (n). The number of samples drawn from the initial sample can be very high when using the bootstrap, as it does not depend on the size of the initial sample.

Both the jackknife and the bootstrap can be applied to basic statistical measurements, such as variance and mean, and to more complex methods, such as LISREL or PLS.

Source: Thietart Raymond-Alain et al. (2001), Doing Management Research: A Comprehensive Guide, SAGE Publications Ltd; 1 edition.

Data Collection and Managing the Data Source

Data collection is crucial to all research. Through this process researchers accumulate empirical material on which to base their research. But before they begin putting together their empirical base, researchers should ask themselves whether any suitable data is already available. Secondary data (or secondhand data) can offer real advantages, as it relieves researchers from conducting their own fieldwork or reduces the fieldwork required. But it can be difficult to track down suitable secondary data, if it does exist, and once located there is the problem of gaining access to it. Knowing how to identify and access data sources, both external and internal to organizations is central to the collection of secondary data.

In the absence of suitable secondary data, or in addition to such data, researchers can collect their own primary data through fieldwork. This brings us to the question of what methods the fieldworker should use.

Data collection methods vary according to whether the researcher adopts a quantitative or qualitative approach. In this chapter we will make a distinction between techniques that can be used in quantitative research and those more suited to qualitative research.

Source: Thietart Raymond-Alain et al. (2001), Doing Management Research: A Comprehensive Guide, SAGE Publications Ltd; 1 edition.

Collecting Primary Data for Quantitative Research

The most developed method of collecting primary data for quantitative research is the questionnaire. We take a particularly close look at mailed ques­tionnaires, as these are used very frequently in management research and necessitate particular techniques. We then present other methods of collecting primary data for quantitative research: observation and experimentation.

1. Surveys

A survey or questionnaire enables researchers directly to question individuals. It is a tool for collecting primary data that adapts well to quantitative research, as it allows the researcher to work with large samples and to establish statisti­cal relationships or numerical comparisons.

Collecting data by survey involves three major steps: initial crafting of the survey and choosing scales, pre-tests to check the validity and reliability of the survey, and then the actual administering of the final version. There are certain procedures that should be followed for each step, to obtain the maximum amount of relevant and usable data. Numerous articles and other published works have gone into lengthy detail about these procedures (Albreck and Settle, 1989; Fink and Kosecoff, 1998; Rossi et al., 1985; Schuman, 1996), but we have chosen here to focus on a number of fundamental points.

1.1. Choosing scales

To craft a survey for quantitative research is, in fact, to construct a measuring instrument. Before tackling the problems of wording the questions and organi­zing the structure of the questionnaire, the researcher must first choose which scales to use (the different types of scales – nominal, ordinal, interval or proportional – are presented in Chapter 4). Not only do researchers need to determine the type of scale to use, they also have to choose between using pre­existent scales or creating their own.

Using pre-existent scales Most questionnaires used in management research combine a number of scales. A researcher may choose to use scales already con­structed and validated by other researchers. These are generally published in the annex of the article or the work in which they are first employed, or they can be obtained by requesting them directly from the researcher who created them. A number of publications (Bearden et al., 1993; Robinson et al., 1991) present a large range of scales. Researcher should be aware, though, that the validity of these pre-existent scales is strongly linked to the context in which they are used. A scale designed to measure the degree of radicalness of an inno­vation in the biotechnology industry may not be able to be transposed to a study of the literary editing sector. Scales developed in a particular country (most often the USA) or socio-cultural context may need to be adapted for use in other contexts. When using scales in other contexts than that for which they were created, researchers must always verify that they are indeed valid in the new context.

Constructing new scales If appropriate scales cannot be found, researchers have to construct their own measuring instruments. Detailed interviews are a good way to obtain a better picture of the phenomenon under study, and they enable the researcher to define coherent items that will be understood by the population being studied. This should then be followed by an initial pre-test phase, to refine the list of questions and to validate the scale.

For a complete description of all the steps to be followed to create new scales, the researcher can refer to detailed works such as Aaker and Day (1990), Devellis (1991) or Tull and Hawkins (1987).

1.2. Designing and pre-testing a questionnaire

Designing the questionnaire Preparing the questions is complex work. The researcher needs to avoid errors in the formulation and organization of the questions as well as in the choice of possible responses. Specialized works on the design of questionnaires make quite precise recommendations (Converse and Presser, 1986; Fink, 1995; Rossi et al., 1985; Schuman, 1996). Here we will simply summarize several fundamental points.

A questionnaire (or survey) generally begins with relatively simple and closed questions. It is preferable to group together questions that are more involved, complex or open at the end of the document. The questions should, as far as possible, follow a logical order that uses thematic groupings and facili­tates the passage from one theme to another. There are two common sources of error that should be avoided when formulating and deciding the order of the questions. The halo effect results from associating a series of successive ques­tions that are too similar to each other. This can occur, for example, when a long series of questions uses the same scale for all modes of response. To avoid the halo effect, the researcher can introduce a change in the form of the questions, or propose an open question. The contamination effect occurs when one ques­tion influences the subsequent question or questions. To guard against this bias, one needs to be scrupulously careful about the order of the questions. The unit of analysis (the industrial sector, the organization, a product line, a particular department …) that a question or a series of questions relates to must always be made clear, and any change of unit should be systematically acknowledged. When the survey includes questions relating to different subjects, it is useful to draw the respondent’s attention to this by introducing the new subject with a short phrase separating the groups of questions.

The pre-test Once the researcher has prepared a first draft of the question­naire, he or she will need to carry out a pre-test – to test the form of the ques­tions and their order, to ensure that respondents understand the questions and to assess whether the proposed modes of reply are relevant (Hunt et al., 1982). Ideally, the draft should be given to several respondents in face-to-face inter­views, so that their non-verbal reactions can be noted. Following this, it is recom­mended that researchers carry out a pre-test using the same method they propose to use for the definitive questionnaire, and under the same conditions of interaction (or non-interaction) with the respondents. Data collected during the pre-test(s) also allows researchers to measure the internal validity of their scales. Through this phase the list of items can be refined so that only those which really measure the phenomenon being studied are retained. By the end of the pre-test phase, the questionnaire should be pertinent, efficient and clear for the researcher as well as for the respondents.

1.3. Administering a questionnaire

There are several ways of administering the questionnaire. It can be adminis­tered electronically – via e-mail, Internet or intranet – interviews can be con­ducted face to face or by video and telephone, or it can be sent out by mail. While each of these methods has a number of specific considerations, it must be remembered that administering the questionnaire harbors its own particular difficulties in each individual case, and always calls for prudence. A danger faced by all researchers is the risk of a weak response rate, which can call the whole research project into question. The issue here is the problem of managing data sources in the context of a survey conducted by questionnaire. Different researchers specializing in crafting questionnaires have proposed administra­tion methods that enable researchers to obtain high response rates (Childers and Skinner, 1979; Dillman, 1978; Linsky, 1975; Yammarino et al., 1991) and we present the most elementary points here. Researchers need to be prepared to adapt these techniques to suit the socio-cultural context of their research and the means at their disposal. Finally, different techniques are used depending on whether the survey is administered by mail, in face to face interviews, by tele­phone or using information technology.

Administering a mailed questionnaire Mailed questionnaires are somewhat particular in that they are auto-administered by the respondents. Given the importance of motivating correspondents to complete a mailed questionnaire, great care must be taken over the document’s general presentation. The ques­tionnaire should be printed on white paper,1 and should be in booklet form. There should be no questions on the first page – this page is often reserved for the title of the study and recommendations for the respondent. An illustra­tion may also be used; sufficiently neutral to avoid the questionnaire being turned into an advertising brochure. It is also preferable to leave the final page free of questions. This page is reserved for the respondent’s comments. To date, researchers have been unable to agree on the ideal length of a mailed questionnaire. Logically, subjects are more reticent about replying to a lengthy questionnaire, which requires more of their time. Certain specialists say ques­tionnaires should not exceed ten pages, while others say they should be limited to four pages.

It is generally recommended to send an accompanying letter with a mailed questionnaire.

Once the questionnaire and accompanying letter have been drawn up, there is the auto-administration of the mailed questionnaire to think about. The fact that the subjects solicited are not in direct contact with the researcher leads to certain difficulties (Bourque and Fielder, 1995). It is impossible to be insistent, to rely on one’s physical presence to help lessen a subject’s reticence. One needs to alleviate these difficulties by developing other forms of contact or conduct. In the following we present some techniques for optimizing auto-administration of a mailed questionnaire.

Administering a questionnaire face to face This procedure allows the researcher to reply directly to any queries respondents may have about the actual nature of the questions. It also makes it easier to check that the sample is representative. The main limitation is that the researcher must always guard against expressing any opinion or sign of approval, or disapproval, at the risk of influencing the respondent. Moreover, this method blocks the responses of certain people who consider them too personal to be expressed face to face. When using this technique to administer a questionnaire, researchers still need to present the study clearly to the respondents, and involve them in its aims. The researcher should have a suitable text prepared to present the question­naire, confronting the same issues as those discussed above for a letter accom­panying a mailed questionnaire.

Administering a questionnaire by telephone It is pointless to pretend that a respondent is anonymous during a telephone conversation. Yet when telephone interviews are used to complete a questionnaire, the researcher is confronted with the dilemma of choosing between personalizing the relationship and maintaining the subject’s anonymity as much as is possible. One compromise solution can be to personalize the conversation while guaranteeing to respect the subject’s anonymity. As with the preceding techniques, the researcher must begin the interaction by explaining the aims of the research and the contribu­tion it will make. Preliminary contact by mail enables the researcher to prepare potential respondents and to explain their particular importance to the study. This technique avoids the element of surprise and lessens the negative reaction that the disturbance of a telephone call can so often provoke.

Administering a questionnaire using information technology There are two pos­sible ways information technology can be used to administer a questionnaire. The researcher may send out a file, a diskette, or a CD-ROM containing a pro­gram the respondents can load into their computers so as to reply directly to the questionnaire. The respondent then sends back a completed file. It is equally possible to ask respondents to connect to a web site – a link can be included in an e-mail – where they will find the questionnaire and can reply to it directly. These two methods have the advantage of freeing the researcher from the unappetizing tasks of envelope-stuffing and mailing, and inputting replies. It can provide data that can be directly used for statistical analyses. Dillman (1999) has gone into lengthy detail on the procedures to follow in his book.

1.4. Advantages and limitations of questionnaires

The questionnaire seems to be one of the most efficient ways of collecting pri­mary data. It also offers the possibility of standardizing and comparing scales, and enables the anonymity of the data sources to be preserved. Nevertheless, data collection by questionnaire has certain limitations. It is not flexible. Once the administration phase is under way, it is no longer possible to backtrack. The researcher can no longer offset a lack of sufficient data or an error in the scale used. Furthermore, standardization of the measurement instrument has a downside: the data gathered using standardized methods is necessarily very perfunctory. Collecting data by questionnaire also exposes the researcher to the bias of the person making the statements. There is a commonly cited difference between declaratory measurements and behavioral measurements.

Some of the advantages and disadvantages inherent to the different methods of administering questionnaires are presented in Table 9.1.

2. Other Ways to Collect Data

There are other ways of collecting primary data for quantitative use. These are principally observation procedures and experimental methods.

2.1. Observation

As noted by Silverman (1993), observation is not a collection method that is used very often in quantitative research. It is difficult to observe large samples, and to obtain a sample that is statistically large enough can require mobilizing several observers. This can entail another problem, that of the reliability of the measurement – as there is a risk that the observations will not be homogeneous. When using this collection method the researcher needs to develop and vali­date a standard (or systematic) observation framework from which to uni­formly describe the types of behavior observed (Bouchard, 1976).

Taking account of the rigidity of such a system, the researcher will need to guard against possible errors of content (resulting from simplification of the observation) or context (inherent to the link between data and situations) and against instrumental bias (due to the researcher’s judgements and assump­tions) (Weick, 1968).

2.2. Experimental methods

Certain experimental methods enable us to draw out quantitative results and to make statistical use of the data collected. The quality of such experimenta­tion rests above all on creating optimum conditions for the participants (behav­ior, willingness to participate, environment, etc.). Participants should never feel obliged to adopt special behavior to suit the experimentation situation. The researcher’s job, therefore, is to create conditions that encourage participants to behave as naturally as possible. There are a number of different methods that can be employed to conduct the experimentation. The researcher can use the protocol method, where subjects are invited to reconstruct and describe ‘out loud’ their internal method of processing information when they need to make a decision. Another experimental method involves the subjects taking part in role-playing.

These experimental methods offer a wealth of information for the researcher. The variables are measurable and can be controlled, and the researcher can establish comparisons and test causal relationships between events. However, experimental methods are sometimes too simplistic and can be limited in terms of external validity. The results should always be analyzed with care, as they often give only limited scope for generalization.

Source: Thietart Raymond-Alain et al. (2001), Doing Management Research: A Comprehensive Guide, SAGE Publications Ltd; 1 edition.

Collecting Primary Data for Qualitative Research

Primary data collection cannot be a discreet step in the research process, par­ticularly in qualitative research, which requires prolonged investigation in the field. This being the case, managing the interaction between the researcher and the data sources is a vital issue. We will conclude this section by presenting seve­ral approaches and source management strategies that can be used for collect­ing primary data.

1. Principal Methods

1.1. Interviewing

Interviewing is a technique aimed at collecting, for later analysis, discursive data that reflects the conscious or unconscious mind-set of individual interviewees. It involves helping subjects to overcome or forget the defense mechanisms they generally use to conceal their behavior or their thoughts from the outside world.

Individual interviews In qualitative research, the interview involves question­ing the subject while maintaining an empathetic demeanor: that is, accepting the subject’s frame of reference, whether in terms of feelings or relevance. Subjects can say anything they wish, and all elements of their conversation have a certain value because they refer directly or indirectly to analytical ele­ments of the research question. This is the opposite of following a set series of predetermined questions, designed to aggregate the thoughts or knowledge of a large number of subjects, as is characteristic of interviewing for quantitative research (Stake, 1995).

If such a principle is followed, the degree to which the researcher directs the dynamics of the interview can vary (Rubin and Rubin, 1995). Traditionally, a distinction is drawn between two types of interview: unstructured and semi­structured. In an unstructured interview, the interviewer defines a general sub­ject area or theme without intervening to direct the subject’s remarks. He or she limits interventions to those that facilitate the discussion, express understanding, provide reminders based on elements already expressed by the subject, or go more deeply into discursive elements already expressed. In a semi-structured interview, also called a ‘focused’ interview (Merton et al., 1990), the researcher applies the same principles, except that a structured guide allows the researcher to broach a series of subject areas defined in advance. This guide is completed during the course of the interview, with the aid of other questions

‘Main questions’ can be modified if, in the course of the interview, the sub­ject broaches the planned subject areas without being pressed by the inter­viewer. In some cases certain questions may be abandoned, for example if the subject shows reticence about particular subjects and the researcher wishes to avoid blocking the flow of the face to face encounter. An interview rarely follows a predicted course. Anything may arise during the interview – interviewing demands astuteness and lively interest on the part of the researcher! In practice, a researcher who is absorbed in taking notes risks not paying enough attention to be able to take full advantage of opportunities that emerge in the dynamics of the interview. For this reason it is strongly advised to tape-record the inter­view, even though this can make the interviewee more reticent or circumspect in his or her remarks. An added advantage is that the taped data will be more exhaustive and more reliable. More detailed analyses can then be carried out on this data, notably content analyses.

Two different interviewing procedures are possible. Researchers can either conduct a systematic and planned series of interviews with different subjects, with an eye to comparing their findings, or they can work heuristically, using information as it emerges to build up their understanding in a particular field. Using the first method, the researcher is rigorous about following the same guide for all of the interviews, which are semi-directed. Using the second method, the researcher aims for a gradual progression in relation to the research question. Researchers might start with interviews that are only slightly structured, with the research question permanently open to debate, which allows subject partici­pation in establishing the direction the research will take. They would then con­duct semi-structured interviews on more specific subject areas. The transition from a ‘creative’ interview to an ‘active’ interview can provide an illustration of this procedure (see below).

When research involves several actors within an organization or a sector, they might not have the same attitude to the researcher or the same view of the research question. The researcher may have to adapt to the attitude of each actor. According to Stake (1995), each individual questioned must be seen as having particular personal experiences and specific stories to tell. The way they are interviewed can therefore be adapted in relation to the information they are best able to provide (Rubin, 1994). Researcher flexibility is, therefore, a key factor in the successful collection of data by interview. It may be useful to organize the interviews so they are partly non-directive, which leaves room for suggestions from the subjects, and partly semi-directive, with the researcher specifying what kind of data is required. As Stake (1995: 65) points out; ‘formulating the questions and anticipating probes that evoke good responses is a special art’.

Group interviews A group interview involves bringing different subjects together with one or more animators. Such an interview places the subjects in a situation of interaction. The role of the animator(s) is delicate, as it involves helping the different individuals to express themselves, while directing the group dynamic. Group interviewing demands precise preparation, as the aims of the session and the rules governing the discourse must be clearly defined at the beginning of the interview: who is to speak and when, how subjects can interject and what themes are to be discussed.

Specialists in qualitative research differ on the effectiveness of group inter­view. Some argue that a group interview enables researchers to explore a research question or identify key information sources (Fontana and Frey, 1994). The interaction between group members stimulates their reflection on the prob­lem put before them (Bouchard, 1976). Others point out that, in group interviews, subjects can become reticent about opening up in front of other participants (Rubin and Rubin, 1995). In management research, the biases and impediments inherent to group interviews are all the more obvious. Care is required when judging the authenticity of the discussion, as power games and the subjects’ ambitions within the organization can influence the flow of the interview. If the inquiry is actually exploring these power games, a group interview will tend to reveal elements that the researcher can then evaluate using other collection methods. A group interview can also be used to obtain confirmation of latent conflicts and tensions within an organization that have already been suggested by other collection methods.

As in individual interviews, the animator of a group interview must be flexible, empathetic and astute. However, running a group interview success­fully requires certain specific talents as well, to avoid altering the interview dynamic, which would distort the data collected (see below). For example, according to Merton et al. (1990), the researcher who is running a group inter­view must:

  • prevent any individual or small coalition from dominating the group
  • encourage recalcitrant subjects to participate
  • obtain from the group as complete an analysis as possible of the subject of the inquiry.

Fontana and Frey (1994) point to another useful talent: knowing how to strike a balance between playing a directive role and acting as a moderator, so as to pay attention both to guiding the interview and to maintaining the group dynamic.

Finally, the group must contain as few superfluous members as possible and should fully represent all actors the research question relates to (Thompson and Demerath, 1952).

Taking into account the points we have just covered, group interviewing, with rare exceptions, cannot be considered a collection technique to be used on its own, and should always be supplemented by another method.

1.2. Observation

Observation is a method of data collection by which the researcher directly observes processes or behaviors in an organization over a specific period of time. With observation, the researcher can analyze factual data about events that have definitely occurred – unlike verbal data, the accuracy of which should be treated with some caution.

Two forms of observation can be distinguished, in relation to the viewpoint the researcher takes towards the subjects being observed (Jorgensen, 1989; Patton, 1980). The researcher may adopt either an internal viewpoint, using an approach based on participant observation, or an external viewpoint, by con­ducting non-participant observation. Between these two extremes, the researcher can also opt for intermediate solutions. Junker (1960) and Gold (1970) define four possible positions the researcher in the field may adopt: the complete partici­pant, the participant as observer, the observer as participant and the complete observer.

Participant observation When carrying out fieldwork, researchers must choose the degree to which they wish to ‘participate’. We distinguish three degrees of researcher participation.

The researcher can, first, be a ‘complete participant’. In this case, he or she does not reveal his or her role as a researcher to the subjects observed. The observation is thus covert. Complete participation presents both advantages and disadvantages. The data collected is not biased by the reactivity of the sub­jects (Lee, 1993). According to Douglas (1976), one of the few supporters of ‘covert’ observation via complete participation, this data collection technique is justified by the conflictual nature of social existence, and the resistance that exists vis-a-vis any type of investigation, even scientific. However, in opting for ‘covert’ observation, researchers may find it difficult to dig deeper, or confirm their observations through other techniques, such as interviewing. They also run the crippling risk of being discovered. The ‘complete participant’ is often led to use sophisticated methods of recording data so as to avoid detection (Bouchard, 1976). They have very little control over selection of their data sources, and their position in the field remains fixed: it cannot be modified, which means important opportunities may be missed (Jorgensen, 1989). Finally, ‘covert’ observation poses serious ethical problems (Punch, 1986). It can only be justified in exceptional circumstances, and cannot be defended by simply arguing that one is observing subjects so as to collect ‘real data’ (Lincoln and Guba, 1985).

The researcher can opt for a lesser degree of participation, taking the role of ‘participant as observer’. This position represents a compromise. The researcher has a greater degree of freedom to conduct the investigations, and he or she can supplement his or her observations with interviews. Nevertheless, the researcher exposes himself or herself to subject reactivity, as he or she is appoin­ted from within the organization. The researcher’s very presence will have an impact on subject-sources of primary data, who may become defensive in face of the investigation. Take the case of a salaried employee in an organiza­tion who decides to do research work. His status as a member of the organiza­tion predominates over his role as researcher. The conflict of roles which arises can make it difficult for the researcher to maintain his or her position as a fieldworker.

Finally, the researcher can be an ‘observer as participant’. His or her partici­pation in the life of the organization being studied remains marginal, and his or her role as a researcher is clearly defined for the subject-sources. At the beginning of the study, the researcher risks encountering resistance from those being observed. However, such resistance can lessen with time, enabling the researcher to improve his or her capacity to conduct the observation. The researcher’s behavior is the determining factor here. If he or she succeeds in gaining the confidence of the subject-sources, he or she then has more latitude to supplement the observation with interviews and to control the selection of data sources. The key is to remain neutral in relation to the subjects.

Non-participant observation There are two types of non-participant observa­tion: casual and formal. Casual observation can be an elementary step in an investigation, with the aim of collecting preliminary data in the field. It can also be considered as a complementary data source. Yin (1989) notes that, during a field visit to conduct an interview, researchers may observe indicators, such as the social climate or the financial decline of the organization, which they could then include in their database. If they decide to supplement verbal data obtained in interviews by systematically collecting observed data (such as details on the interviewee’s attitude and any non-verbal communication that may take place), the observation can then be described as formal. Another way of carrying out formal observation as part of qualitative research can be sys­tematically to observe certain behaviors over specific periods of time.

  1. 1.3. ‘Unobstrusive’ methods

There is another way of collecting primary data that bisects the classification of collection methods that we have adopted so far. This involves using ‘unobstru- sive’ methods. The primary data collected in this way is not affected by the reactivity of the subjects, as it is gathered without their knowledge (Webb et al., 1966). As demonstrated in Chapter 4, data obtained in this fashion can be used to supplement or confirm data collected ‘obtrusively’.

Webb et al. (1966) proposed a system of classifying the different elements the researcher can use to collect data ‘unobtrusively’ into five categories:

  • Physical traces: such as the type of floor covering used (generally more hard-wearing when the premises are very busy), or the degree to which shared or individual equipment is used.
  • Primary archives used (running records): includes actuarial records, politi­cal and judicial records, other bureaucratic records, mass media.
  • Secondary archives, such as episodic and private records: these can include sales records, industrial and institutional records, written documents.
  • Simple observations about exterior physical signs: such as expressive move­ments, physical location, use of language, time duration.
  • Behavior recorded through various media: includes photography, audio­tape, video-tape.

2. Coordinating Data Sources

One of the major difficulties facing a researcher who wants to conduct qualita­tive management research lies in gaining access to organizations and, in par­ticular, to people to observe or interview. Researchers need to show flexibility when interacting with the subject-sources of primary data. As the sources are reactive, researchers can run the risk of contaminating them.

2.1. Accessing sources of primary data

Authorized access It is crucial for researchers to establish beforehand whether they need to obtain authorized access to the site they wish to study. Such authori­zation is not given systematically. Many organizations, either to foster a reci­procal relationship with the research community, or simply by giving in to the mutual curiosity that exists between researchers and potential subjects, do allow access to their employees and sites (offices, production plants, etc.). Other organi­zations cultivate a culture of secrecy and are more inclined to oppose investiga­tion by researchers. That said, should one refrain from working on a particular site because the company does not allow access? If this were the case, many research projects would never have seen the light of day. A great deal of infor­mation can be accessed today without the permission of those it concerns. It is also possible, if need be, to conduct interviews without the express agreement of the company involved. It is, however, more prudent to make the most of oppor­tunities to access organizations that welcome researchers. By adopting this stand­point you can avoid having to confront conflict situations which, even if they do not call the actual research project into question, are nevertheless costly, as they demand extra effort on the part of the researcher. It is therefore useful to gain access to primary data-sources.

Building up trust Negotiating access to a site requires time, patience, and sen­sitivity to the rhythms and norms of a group (Marshall and Rossman, 1989). Taking things gradually can minimize the potential threat the researcher may represent, and avoid access to the site being blocked (Lee, 1993). Researchers can use collection methods such as participant observation and in-depth inter­viewing to familiarize themselves with the context in which they are working and avoid, or at least delay, making any potentially damaging faux pas. These methods provide an opportunity to build the kind of trust that is the key to accessing data. While a subject’s trust in a researcher does not guarantee the quality of the data collected, an absence of trust can prejudice the data signifi­cantly (Lincoln and Guba, 1985). To win the trust of the data sources, the researcher may need to obtain the sponsorship of an actor in the field. The sponsorship technique saves considerable time. Lee (1993) discusses the most well-known and best example of this technique: Doc, the leader of the Norton gang studied by Whyte (1944) in Street Corner Society. It is, in fact, thanks to Doc that Whyte, whose first attempts to enter the Street Corner Society were a failure, was finally able to gain access. This example illustrates the fundamental nature of a sponsor: he or she must have the authority to secure the other subjects’ acceptance of the researcher.

While having the backing of someone in the field is sometimes very useful, it can nevertheless lead to serious disadvantages in data collection. There are three different roles that sponsors may adopt (Lee, 1993). They can serve as a ‘bridge’ to an unfamiliar environment. They can also serve as a ‘guide’, sug­gesting directions and, above all, alerting the researcher to any possible faux pas in relation to the subjects. Finally, they can be a sort of ‘patron’ who helps the researcher to win the trust of the other subjects by exerting a degree of con­trol over the research process. Access to the field is obtained indirectly via the ‘bridge’ and the ‘guide’ and, directly, via the ‘patron’. Lee (1993) highlights the other side of the coin in relation to access with the help of a sponsor. In bring­ing the researcher onto the site, or sites, being studied, patrons exert an influ­ence inherent to their reputation, with all the bias this entails. Moreover, according to our own observations, the sponsor as ‘patron’ can limit the study through the control he or she exercises over the research process. Sponsors can become adversaries if the process takes what they consider to be a threatening turn. Researchers must therefore take care not to turn systematically to the same sponsor, or they run the risk of introducing a ‘heavy’ instrumental bias. Subjects will unavoidably be selected through the prism of the sponsor’s per­ception, rather than according to theoretical principles. To avoid this type of phenomenon, researchers should take advantage of their familiarity with the terrain and seek the patronage of other actors.

Flexibility Always indispensable when using secondary data (for example, in relation to data availability), researcher flexibility (or opportunism) becomes even more necessary when managing primary data sources. It is pointless to envisage a research project without taking into account the interaction between the researcher and the sources of primary data. The researcher is confronted by the element of the unknown as ‘what will be learned at a site is always depen­dent on the interaction between investigator and context’ and ‘the nature of mutual shapings cannot be known until they are witnessed’ (Lincoln and Guba, 1985: 208).

2.2. Source contamination

One of the critical problems in managing primary data lies in the various con­tamination phenomena researchers have to confront. While they need not operate in a completely neutral fashion, they must both be conscious of and carefully manage the contamination risks engendered by their relationships with their sources.

Three types of contamination can occur: intra-group contamination, con­tamination between the researcher and the population interviewed, and con­tamination between primary and secondary data sources. We can define contamination as any influence exerted by one actor upon another, whether this influence is direct (persuasion, seduction, the impression one makes, humor, attitude, behavior, etc.) or indirect (sending a message via a third party, sending unmonitored signals to other actors, circulation of a document influencing the study sample, the choice of terms used in an interview guide, etc.).

Intra-group contamination is born of the interaction between the actors interviewed. When a researcher is conducting a long-term investigation on a site, those involved talk among themselves, discussing the researcher’s inten­tions and assessing what motivates his or her investigations. If a sponsor intro­duced the researcher, the actors will tend to consider the sponsor’s motivation and that of the researcher as one and the same. The researcher can appear to be a ‘pioneering researcher’ guided by the sponsor. The subject-sources of primary data will tend to contaminate each other when exchanging mistaken ideas about the researcher’s role. The effect is that a collective attitude is generated towards the researcher, which can heavily influence the responses of the inter­viewees. When a researcher is working on a sensitive site, the collective interests associated to the site’s sensitivity tends to increase intra-group contamination (Mitchell, 1993). The sponsor’s role as a mediator and conciliator becomes essential in ensuring that the researcher continues to be accepted. However, while well intentioned, sponsors – if not sufficiently briefed by the researcher – can do more harm than good by giving the group a biased picture of the research objectives so as to make their ‘protege’ better accepted.

The sponsor can also contaminate the researcher. This happens quite often, as the sponsor, in providing access to the actors will, at the same time, ‘mold’ the interviewee population and the sequence of the interviews. This first type of influence can be benign as long as the sponsor does not take it upon himself or herself to give the researcher his or her personal opinion about – or evalua­tion of – ‘the actor’s real role in the organization’. It is very important that researchers plan exactly how they are going to manage their relationship with the sponsor, as much in the sense of limiting this key actor’s influence on the research process, as in relation to ensuring that those being studied do not lose their confidence in the research and the researcher.

Finally, secondary sources can be both contaminated and contaminating at the same time. Where internal documents are concerned, researchers must take care they have clearly identified the suppliers and authors of the secondary sources used. Actors may influence, or may have influenced, these sources. For example, actors have a tendency to create firewalls and other barriers when archiving or recording internal data so as to hide their errors by accentuating the areas of uncertainty in the archives. In large industrial groups, these fire­walls are constructed using double archiving systems that separate Head Office archives from those labeled ‘General Records’ or ‘Historical Records’. This works as a filtering mechanism to shield the motivations behind, or the real conditions surrounding, the organization’s decisions. This is all the more true in a period of crisis, when urgent measures are taken to deal with archives (the destruction of key documents, versions purged before being archived). In such a case the data available to researchers will hamper their work, as it portrays a situation as has been ‘designed’ by the actors involved.

While one cannot circumvent this problem of contamination, one solution lies in the researcher systematically confronting actors with any possibilities of contamination discovered during the course of the research. Researchers can resort to double-sourcing, that is, confirming information supplied by one source with a second source. They can make the actors aware of the possibility of contamination, asking for their help to ‘interpret’ the available secondary sources. Another solution lies in replenishing one’s sources, and removing those sources that are too contaminated. This demands a heavy sacrifice on the part of the researcher, who must discard as unusable any data that is likely to be contaminated. Such an approach nevertheless enables researchers to guar­antee the validity of their results.

3. Strategies for Approaching and Managing Data Sources

We present several strategies for approaching and managing data sources. We describe the options open to researchers depending on their research question, the context of their data collection and their personal affinities.

3.1. Contractual and oblative approaches

To avoid misunderstanding, and as protection if any disputes arise, one can consider bringing the research work within the terms of a contract. This can reassure the organization that the researcher’s presence on their premises will be for a limited time period. Indeed, access to all of an organization’s data sources, both primary and secondary, can be conditional to the existence of such a contract. The contract generally relates to the researcher’s obligation to provide the organization in question with a report of the research. To protect their own interests, researchers should be as honest and precise as possible about the purpose of their research.

A contractual framework can influence the research work. The contract should clearly specify which data collection methods are to be employed, as such precision can be very useful if any disputes arise. Although researchers may at times seek funding from an organization to finance their work, if they wish to have a significant degree of freedom, they should avoid placing them­selves in a subordinate position. It could be in the researcher’s interest to place reasonable limits on any contractual responsibility. The most crucial part of a research contract with an organization concerns the confidentiality of the results and publication rights. It is legitimate for an organization to protect the confidentiality of its skills, designs, methods, codes, procedures and docu­ments. While it is useful to submit one’s work to the organization before final publication, the researcher must not become a ‘hostage’ to the organization’s wishes. In fact, a researcher can set a deadline for the organization to state any disagreement, after which authorization to publish is considered to have been given. Finally, it is worthwhile remembering that researchers retain intellec­tual property rights over their work, without any geographic or time limit. Negotiations over intellectual property rights can very quickly become diffi­cult, particularly if the research concerns the development of management instruments.

In contrast to this contractual arrangement, the researcher can take a much more informal approach, which we will describe as oblative, as it is based on a spirit of giving. While it may well seem anachronistic to refer to a gift in management research, this kind of approach can turn out to be highly produc­tive in terms of obtaining rare and relevant data. If the researcher is keen for the subjects to participate in crafting the research question, and establishes an interpersonal relationship that is specific to each case and is based on mutual trust, patiently built up, subjects can become the source of invaluable data. An oblative approach is founded on trust and keeping one’s word. The choice of an oblative approach can be justified if the researcher wishes to maintain a large degree of flexibility in his or her relationship with the primary data sources.

3.2. Covert or overt approaches

In approaching data sources, researchers face the following dilemma: should they employ a ‘covert’ approach – retaining absolute control over the manage­ment of the primary data sources and conducting an investigation in which they hide their research aims – or should they opt for an ‘overt’ approach – in which they do not hide their objectives from the subject-sources, but offer them greater control over the investigation process. Each of these options presents advantages and disadvantages.

The choice of a ‘covert’ investigation greatly limits a researcher’s movements in the field, as actors may harbor suspicions about the researcher’s intentions (Lee, 1993). Also, because it leaves the subject no latitude, this type of data- source management raises difficulties regarding the morality of the underlying method (Whyte, 1944). The researcher cannot assume ‘the right to deceive, exploit, or manipulate people’ (Warwick, 1982: 55).

The choice of an ‘overt’ approach, whereby researchers do not hide their research aims, means they have to confront the phenomenon of subject reactiv­ity. ‘If the researcher must expose all his intentions in order to gain access, the study will be hampered’ (Marshall and Rossman, 1989: 56). The researcher also runs the risk of being refused access to the site. An ‘overt’ approach must be parsimonious, and take account of the specificity of the interaction with each subject, the maturity of the researcher-subject relationship, and its limits. Choosing such an approach involves going beyond the strictly technical and calling upon qualities such as ’empathy, sensitivity, humor and sincerity’, which ‘are important tools for the research’ (Rubin and Rubin, 1995: 12).

All told, we consider that, if data is to be collected ‘overtly’, that is with the subjects’ knowledge, managing primary data-sources involves a certain trans­parency. The ‘covert’ approach, though, seems to us only to be compatible with more discreet collection techniques: collection without the subjects’ knowl­edge. Such an approach needs to be justified from an ethical point of view: by the fact that the reactivity of the subjects would constitute an instrumental bias, and by the innocuous nature of the research results as far as the subjects are concerned.

3.3. Distance or intimacy in relation to the data source

Should one develop an intimate relationship, or should a certain distance be maintained in relation to the subjects? It is necessary, in this respect, to take account of the ‘paradox of intimacy’ (Mitchell, 1993). The more the researcher develops ‘intimacy’ with those being questioned, the more the interviewees will tend to reveal themselves and disclose information. However, such an attitude on the part of the researcher can have an extremely negative impact on the research in terms of internal validity. The more a researcher becomes involved in ‘dis-inhibiting’ a research subject-source, the more he or she will tend to enter into agreement with the actor, offering a reciprocal degree of intimacy. As Mitchell has pointed out, the researcher also exposes himself or herself to the possibility that the subjects will ‘turn against him or her’ when his or her work is published. After publishing a study of mountain-climbers, Mitchell (1983) was accused of having ‘spied’ on them to obtain his information, when the data had, in fact, become available because the author developed strong intimacy with certain subject-sources. Intimacy with sources can pose very serious problems of loyalty in the relationship after the research work has been completed.

Managing the dilemma of distance versus intimacy also poses problems relating to the amount of information the researcher acquires in the field and the emotional involvement developed with the actors concerned. Mitchell suggests two key aspects that should be considered when looking at the researcher’s role: the knowledge researchers acquire about the site, and their emotional involvement with the subjects (see Figure 9.1.).

Source: Thietart Raymond-Alain et al. (2001), Doing Management Research: A Comprehensive Guide, SAGE Publications Ltd; 1 edition.

Collecting Secondary Data

Secondary data is data that already exists. It is advisable to systematically begin a research project by asking whether any appropriate secondary data is available. Use of such data presents numerous advantages. It is generally inex­pensive, it has already been assembled, and it does not necessarily require access to the people who supplied it. It has historical value and is useful for establishing comparisons and evaluating primary data. However, secondary data can be difficult to obtain, or obsolete, and can vary in the degree to which it is approximate or exhaustive. Moreover, it is possible that the data format does not fully correspond with that used by the researcher, in which case it has to be changed from its original form into a format better suited to present needs. Researchers, therefore, have to understand exactly why the data was originally put together before they can decide to use it or not.

1. Internal Secondary Data

Internal secondary data is information that has already been produced by organi­zations or private individuals. The data was not collected to respond to the specific needs of the researcher, but constitutes a veritable data-source for those consulting it. Archives, notes, reports, documents, rules and written proce­dures, instructions and press cuttings are just some of the types of internal data the researcher can use.

There are several advantages with such data. First, analyzing it enables one to reconstitute past actions that have had an influence on events and decisions and involved individuals. The use of internal data, indispensable within the framework of an historical and longitudinal procedure (monogra- phy, process analysis over a lengthy period), generates information that actors do not discuss spontaneously during face to face interviews. It is, therefore, normal for researchers to begin by gathering documentation and informing themselves about their subject by collecting such data. Finally, it is often necessary to analyze internal data in order to triangulate the data and validate its reliability.

However, analyzing archives and internal documents can pose problems. First, documentary sources can be difficult to use on their own. In terms of con­tent, such data cannot always be easily validated, and one must, therefore, identify any possible bias on the part of those who compiled it or authorized its compilation. We saw in Section 2 of this chapter that contamination of pri­mary data can spread to secondary data. We also underlined the bias that exists when one is not aware of a system of double archives. As researchers do not always have sufficient information to discover the context in which particular documents were drawn up, they must interpret them subjectively, and give thought to any possible validation problems that might arise when using this kind of source.

To collect such data, the researcher needs to be in contact with people on the site being studied. With semi-private data, access can be relatively easy. This is the case, for example, with reports of the activities of firms quoted on the stock exchange, and with university research or public studies. It is also possible to consult certain archives belonging to chambers of commerce, trade unions and political organizations and, more generally, all the administrative bodies that are responsible for keeping public or semi-public statistics. However, such docu­ments are not always very accessible for reasons of confidentiality or poor dis­tribution. Access to internal secondary data is, therefore, neither automatic nor easy to obtain.

How to process the information depends on the type of data collected. When data is presented purely in the form of documents, researchers generally analyze their content. When it is in numerical form, they would be more likely to conduct statistical or accounting analyses.

In summary, the main advantage of collecting internal data is the low cost of accessing the information, but one should take great care when pro­cessing it.

2. External Secondary Data

To collect external secondary data, it is worthwhile going to libraries and other documentation centers with a large stock of periodicals and other works deal­ing with the research field one has in mind. Access to theses and studies that have already been published or are in progress is indispensable to the spread of knowledge and evolution of research. Two important steps are to identify and to read works by researchers working on the same question. When one is starting a research project, these steps enable better targeting and justification of the subject. During the course of the research, they enable the researcher to remain permanently in touch with the evolution of the subject and any changes in the views of other researchers. Governmental publications (such as official documents or ministerial studies), publications produced by public and/or international organizations and private publications are all important sources of external data. Finally, press cuttings and private directories (Kompass, Who Owns Who …) are easy to access in order to build up files on the organizations being studied. To sum up, many findings are the fruit of chance discoveries on library shelves, chatroom discussions over the Internet, or the consultation of web sites related to the subject.

Source: Thietart Raymond-Alain et al. (2001), Doing Management Research: A Comprehensive Guide, SAGE Publications Ltd; 1 edition.

Data-Source Confidentiality

Management research is carried out in a context that can be ‘sensitive’, and the degree of sensitivity can vary. The researcher’s investigation may constitute a threat to the organizations being studied and their members. This potential threat can be internal, relating to the risk of actors’ attitudes or behavior being revealed, which can have consequences on the life of the organization. ‘The presence of a researcher is sometimes feared because it produces a possibility that deviant activities will be revealed’ (Lee, 1993: 6). The researcher may repre­sent a threat vis-a-vis the world outside the organization, as that which relates to the management of an organization can have an impact on the organization’s relationship with its environment. It is, therefore, imperative to underline that all management research is characterized by varying degrees of confidentiality. The degree of confidentiality will also vary depending on the personality of the actors the researcher is brought into contact with.

Confidentiality imposes three kinds of constraint on the researcher. First there is the question of protecting confidentiality during the course of the research. Confidentiality can also have implications on the validation of results by subject- sources. The final problem relates to publication of the research results.

1. Protecting Data Confidentiality

Researchers working on ‘sensitive’ topics must understand the risks their data sources may run. In this situation researchers are confronted with the need to protect the results of the inquiry – their notes and the transcriptions of their interviews. They need to ensure that the anonymity of the subjects being ques­tioned or observed, and the organizations being studied, is protected.

2. Using Data-sources to Validate Results

In the April 1992 edition of the Journal of Culture and Ethnography, Whyte was criticized for failing to follow the deontological principle of submitting the results of his analysis of Cornerville society to all those he met and observed. Whyte replied that, at the time he carried out his work, he had never heard of such a principle and that, most importantly, his analysis could have unfortunate consequences on relationships between the actors concerned and on the image they had cultivated of themselves (Whyte, 1993). This latter point seems to us to be essential. Although the principle of having subjects validate research results is justly recommended by numerous authors (Miles and Huberman, 1984b; Lincoln and Guba, 1985) in accordance with the research principle of refutation (Glaser and Strauss, 1967), if actors are to be ‘required’ to read the researcher’s findings so as to provide an alternative formulation or interpretation (Stake, 1995), it is no less necessary to take account of the possible ‘sensitive’ character of the elements brought forward. One solution is to conceal certain results according to the specific position of the actors consulted. We agree with Whyte in considering it pointless to require all subjects questioned or observed to par­ticipate in validating the results of a research project. Both the results that are presented and the subjects they are presented to must be selected judiciously. It is clear that the familiarity the researcher will have acquired with the field (Miles and Huberman, 1984b), will be of great help in this procedure.

3. Publishing the Research

Publication of research results is the final issue to consider as far as the issue of managing data sources is concerned, whether the terrain is considered to be ‘sensitive’ or not. Maintaining the anonymity of data sources means other researchers are less able to verify the research results. However, cooperation of those in the field may be conditional on the use of pseudonyms. In this case, the researcher must take care that the link between the pseudonyms and the real actors is not too easy to establish. It may be useful to submit all publica­tion plans to these sources to obtain their agreement. Nevertheless, this method has the disadvantage of being heavy to manage; it also imposes restrictions on the researcher, as the sources may abuse their discretionary power. The researcher may be faced with the dilemma between respecting the moral contract established with the subject-sources and the need to publish the final work (Punch, 1986).

Source: Thietart Raymond-Alain et al. (2001), Doing Management Research: A Comprehensive Guide, SAGE Publications Ltd; 1 edition.

Research Validity and Reliability

One of the questions researchers often ask is how their research can be both precise and of practical use to other researchers. To what extent can their results contribute to the area of science in which they work? To answer these questions researchers need to evaluate their work in relation to two criteria, that of valid­ity and of reliability.

To assess the overall validity of our research (and its reliability, as we will see later on), it is necessary to be sure of various more specific types of validity. These include construct validity, the validity of the measuring instrument, the internal validity of the research results and the external validity of those same results. These different kinds of validity concern both the research in its entirety (internal and external validity), and individual research components (the con­cepts or the measuring instruments used).

Although this chapter analyzes each of these different types of validity individually, it is not always possible to determine tests specific to each one.

More generally, there are two main concerns in relation to validity: assess­ing the relevance and the precision of research results, and assessing the extent to which we can generalize from these results. The first is a question of testing the validity of the construct and the measuring instrument, and the internal validity of the results – these three tests can in some cases involve very similar techniques. The extent to which we can generalize from research results is essentially a question of assessing the external validity of these results.

In assessing reliability we try to establish whether the study could be repeated by another researcher or at another time with the same results. This concept, like validity, involves two different levels: the reliability of the measuring instrument and the more overall reliability of the research. Even though these criteria have long been considered as applying only to quantitative research, the question of the validity and reliability of research applies as much to quali­tative as to quantitative work. There is an essential difference, however, in that we test quantitative research to assess its validity and reliability, whereas with qualitative research, rather than testing, we take precautions to improve validity and reliability.

There is no single method for testing the validity and reliability of a research project. Some techniques used for quantitative research can be inappropriate for qualitative research, which has led recent studies (Miles and Huberman, 1984a; Silverman, 1993) to propose validation techniques appropriate to a quali­tative methodology.

Source: Thietart Raymond-Alain et al. (2001), Doing Management Research: A Comprehensive Guide, SAGE Publications Ltd; 1 edition.

Construct Validity in the Research

1. Definition and Overview

The concept of construct validity is peculiar to the social sciences, where research often draws on one or several abstract concepts that are not always directly observable (Zaltman et al., 1973). These can include change, performance, or power. Concepts are the building blocks of propositions and theories used to describe, explain or predict organizational phenomena. As they are abstract forms that generally have several different meanings, it is often difficult to find rules to delimit them. Because of this it is important that the researcher’s prin­cipal concern is the need to establish a common understanding of the concepts used. This poses the question of the validity of these concepts, and in the fol­lowing discussion and in Table 10.1 we present several different approaches to concept validity (Zaltman et al., 1973).

Among the different types of validity, those most often used are criterion- related validity content validity and construct validity. However, as Carmines and Zeller (1990) emphasize, criterion validation procedures cannot be applied to all of the abstract concepts used in the social sciences. Often no relevant cri­terion exists with which to assess a measure of a concept. (For example while the meter-standard forms a reference criterion for assessing distance, there is no universal criterion for assessing a measure of organizational change). In the same way, content validity assumes we can delimit the domain covered by a concept. For example, the concept ‘arithmetical calculation’ incorporates addition, subtraction, multiplication and division. But what is covered by con­cepts such as organizational change or strategic groups? Content validity is therefore quite difficult to apply in the social sciences (Carmines and Zeller, 1990). As pointed out by Cronbach and Meehl (1955: 282),1 it seems that only construct validity is really relevant in social sciences: ‘construct validity must be investigated whenever no criterion on the universe of content is accepted as entirely adequate to define the quality to be measured’.

One of the main difficulties in assessing construct validity in management research lies in the process of operationalization. Concepts are reduced to a series of operationalization or measurement variables. For example, the concept ‘organi­zational size’ can be operationalized through the variables turnover, number of employees or total assets. Such variables are observable or measurable indicators of a concept that is often not directly observable. We call this operationalized con­cept the ‘construct’ of the research. When we address construct validity, we do not attempt to examine the process of constructing the research question, but the process of operationalizing it. Research results are not measures of the theoretical concept itself, but measures of the construct – the concept as it is put into opera­tion. In questioning the validity of the construct we must ensure that the opera­tionalized concept expresses the theoretical concept.

2. Assessing Construct Validity

2.1. Quantitative research

Testing construct validity in a quantitative research project consists most often in determining whether the variables used to measure the phenomenon being studied are a good representation of it.

To achieve this, researchers need to ensure that different variables used to measure the same phenomenon correlate strongly with each other (‘convergent validity’) and that variables used to measure different phenomena are not per­fectly correlated (‘discriminant validity’). In other words, testing construct validity comes down to confirming that variables measuring the same concept converge, and differ from variables that measure different concepts. To mea­sure the correlation between items, researchers can use Campbell and Fiske’s (1959) multitrait-multimethod matrix.

The researcher can equally well turn to other statistical data-processing tools. In particular, factor analysis can be used to measure the degree of con­struct validity (Carmines and Zeller, 1990).

2.2. Qualitative research

For qualitative research we need to establish that the variables used to opera­tionalize the studied concepts are appropriate. We also need to evaluate the degree to which our research methodology (both the research design and the instruments used for collecting and analysing data) enables us to answer the research question. It is therefore essential, before collecting data, to ensure that the unit of analysis and the type of measure chosen will enable us to obtain the necessary information: we must define what is to be observed, how and why.

We must then clearly establish the initial research question, which will guide our observations in the field. Once this has been done, it is then essential to define the central concepts, which more often than not are the dimensions to be measured. For example, in order to study organizational memory, Girod- Seville (1996) first set out to define its content and its mediums. She defined it as the changeable body of organizational knowledge (which is eroded and enhanced over time) an organization has at its disposal, and also clearly defined each term of her definition.

The next step consists of setting out, on the basis of both the research ques­tion and existing literature, a conceptual framework through which the various elements involved can be identified. This framework provides the basis on which to construct a methodology, and enables the researcher to determine the characteristics of the observational field and the units of the analysis. The con­ceptual framework describes, most often in a graphic form, the main dimen­sions to be studied, the key variables and the relationships which are assumed to exist between these variables. It specifies what is to be studied, and through this determines the data that is to be collected and analyzed.

The researcher should show that the methodology used to study the research question really does measure the dimensions specified in the concep­tual framework. To this end, writers such as Yin (1989) or Miles and Huberman (1984a) propose the following methods to improve the construct validity of qualitative research:

  • Use a number of different sources of data.
  • Establish a ‘chain of evidence’ linking clues and evidence that confirm an observed result. This should enable any person outside the project to follow exactly how the data has directed the process, leading from the formulation of the research question to the statement of the conclusions.
  • Have the case study verified by key actors.

Example: Strategies used in qualitative research to improve construct validity (Miles and Huberman, 1984a; Yin, 1989)

Multiple data-sources: interviews (open, semi-directive, to correlate or to validate), documentation (internal documents, union data, internal publications, press arti­cles, administrative records, etc.), the researcher’s presence in the field (obtaining additional information about the environment, the mood in the workplace, seeing working conditions firsthand, observing rituals such as the coffee-break, informal meetings, etc.).

Having key informants read over the case study: this includes those in charge of the organizational unit being studied, managers of other organizational units, mana­gers of consultant services that operate within the organization.

Source: Thietart Raymond-Alain et al. (2001), Doing Management Research: A Comprehensive Guide, SAGE Publications Ltd; 1 edition.

Research Reliability and Validity of the Measuring Instrument

1. Definition and Overview

In the social sciences, measurement can be defined as the process that enables us to establish a relationship between abstract concepts and empirical indica­tors (Carmines and Zeller, 1990). Through measurement, we try to establish a link between one or several observable indicators (a cross in a questionnaire, a sentence in a meeting or a document, an observed behavior, etc.) and an abstract concept, which is not directly observable, nor directly measurable, and which we aim to study. We try to determine the degree to which a group of indicators represents a given theoretical concept. One of the main preoccupa­tions of researchers is to verify that the data they plan to collect in the field relates as closely as possible to the reality they hope to study. However, numer­ous occasions for error are likely to arise, making every method of measuring phenomena or the subject being observed more difficult. These errors can include: actors giving false information; tired observers transcribing their observations badly; changes in the attitudes of respondents between two sur­veys; or errors in the process of transforming qualitative data into quantitative data. It is therefore essential to ensure that empirical indicators (or field data) are comparable to the measurements employed. This will provide the best pos­sible representation of the phenomenon being investigated. The researcher must, then, consider – for each measurement used – the question of its reliabil­ity and its validity. This in turn makes it necessary to address the process by which this measurement has been obtained or arrived at: researchers must demonstrate that the instrument or the instruments used enable them to obtain reliable and valid measurements.

To be reliable, a measuring instrument must allow different observers to measure the same subject with the same instrument and arrive at the same results, or permit an observer to use the same instrument to arrive at similar measures of the same subject at different times. To be valid, the instrument must on the one hand measure what it is expected to measure, and on the other hand give exact measures of the studied object.

The validity, just as much as the reliability, of a measuring instrument is expressed in degrees (more or less valid, more or less reliable) and not in absolute terms (valid or not valid, reliable or not reliable). Researchers can assess the validity or reliability of an instrument in comparison with other instruments.

2. Assessing the Reliability of a Measuring Instrument

In assessing reliability, the researcher is assessing whether measuring the same object or the same phenomenon with the same measuring instrument will give results that are as similar as possible. Correlations between dupli­cated or reproduced measurements of the same object or phenomenon, using the same instrument, need to be calculated. This duplication can be carried out either by the same observer at different times, or by different observers simultaneously.

2.1. Measuring instruments used in quantitative research

To assess the reliability and validity of quantitative measuring instruments, researchers are most often drawn to refer to the true value model. This consists of breaking the result of a measurement into different elements: the true value (theoretically the perfect value) and error terms (random error and non-random error).

The measure obtained = true value + random error + non-random error

  • ‘Random error’ occurs when the phenomenon measured by an instrument is subject to vagaries, such as circumstances, the mood of the people being questioned, or fatigue on the part of the interviewer. It is important, how­ever, to note that the very process of measuring introduces random error. The distinction between different indicators used should not be made according to whether or not they induce random error, but rather according to the degree of random error. Generally, random error is inversely related to the degree of reliability of the measuring instrument: the greater the reli­ability, the smaller the random error.
  • ‘Non-random error’ (also called ‘bias’), refers to a measuring instrument producing a systematic biasing effect on the measured phenomenon. A thermometer that measures 5 degrees more than the real temperature is producing a non-random error. The central problem of the validity of the measuring instrument is bound to this non-random error. In general terms, the more valid the instrument, the smaller the non-random error.

Later in this chapter (section 3.1) we will discuss techniques used to improve measurement validity.

In the following discussion we will focus essentially on measuring scales (used in questionnaires), as these constitute the main group of tools used with quantitative approaches. As the reliability of a measurement is linked to the risk that it will introduce random error, we present below four methods used to estimate this reliability.

‘Test-retest’ This method consists in carrying out the same test (for example posing the same question) on the same individuals at different times. We can then calculate a correlation coefficient between the results obtained in two suc­cessive tests. However, these measurements can be unstable for reasons inde­pendent of the instrument itself. The individuals questioned might themselves have changed; to limit this possibility, there should not be too much delay between the two tests. The fact of having been given the test previously may also sensitize a subject to the question, and predispose him to respond differently in the second test – subjects may have given the problem some thought, and perhaps modified their earlier opinions. It has also been observed, conversely, that if the time lapse between two measurements is too short, actors often remember their first response and repeat it despite apparent changes.

Alternative forms This method also involves administering two tests to the same individuals, the difference being that in this case the second test is not identical to the first; an alternative questionnaire is used to measure the same object or phenomenon, with the questions formulated differently. Although this method limits the effect that memory can have on test results (a source of error with the test-retest method), it is sometimes difficult in practice to design two alternative tests.

‘Split-halves’ This method consists of giving the same questionnaire at the same time to different actors, but in this case the items are divided into two halves. Each half must present the phenomenon the researcher seeks to measure, and contain a sufficient number of items to be significant. A coefficient correlation of the responses obtained in each half is then calculated (one of the most com­monly used of such coefficients is that of Spearman-Brown (Brown, 1910; Spearman, 1910). The difficulty of this method lies in the division of question­naire items – the number of ways of dividing these items increases greatly as the number of items contained in a scale increases. This problem of dividing the items is a limitation of this method, as the coefficients obtained will vary in line with the division method used. One solution to this problem consists in num­bering the items and dividing the odd from the even.

Internal consistency Methods have been developed to estimate reliability coefficients that measure the internal cohesion of a scale without necessitating any dividing or duplicating of items. Of these coefficients the best known and most often used is Cronbach’s Alpha (Cronbach, 1951).

Cronbach’s Alpha is a coefficient that measures the internal coherence of a scale that has been constructed from a group of items. The number of items ini­tially contained in the scale is reduced according to the value of the coefficient alpha, so as to increase the reliability of the construct’s measurement. The value of a varies between 0 and 1. The closer it is to 1, the stronger the internal cohe­sion of the scale (that is, its reliability). Values equal to 0.7 or above it are gene­rally accepted. However, studies (Cortina, 1993; Kopalle and Lehman, 1997; Peterson, 1994) have shown that interpretation of the alpha coefficient is more delicate than it may seem. The number of items, the degree of correlation between the items and the number of dimensions of the concept being studied (a concept may be unidimensional or multidimensional) all have an impact on the value of a. If the number of items contained in the scale is high, it is pos­sible to have an a of an acceptable level in spite of a weak correlation between the items or the presence of a multidimensional concept (Cortina, 1993). It is therefore necessary to make sure before interpreting an alpha value that the concept under study is indeed unidimensional. To do this a preliminary factor analysis should be carried out. The a coefficient can be interpreted as a true indicator of the reliability of a scale only when the concept is unidimensional, or when relatively few items are used (six items, for example).

Of the methods introduced above, the alternative forms method and the Cronbach Alpha method are most often used to determine the degree of relia­bility of a measuring scale, owing to the limitations of the test-retest and the split halves methods (Carmines and Zeller, 1990).

2.2. Measuring instruments used in qualitative research

While we face the problem of reliability just as much for qualitative instru­ments as for quantitative instruments, it is posed in different terms. As Miles and Huberman (1984a: 46) point out:

continuously revising instruments puts qualitative research at odds with survey research, where instrument stability (for example test-retest reliability) is required to assure reliable measurement. This means that in qualitative research issues of instrument validity and reliability ride largely on the skills of the researcher. Essentially a person – more or less fallibly – is observing, interviewing and recording while modifying the observation, interviewing and recording devices from one field trip to the next.

The continual revision of instruments makes qualitative research the exact opposite of quantitative research, in which the stability of the instrument is essential for a reliable measure. In qualitative research, instrument validity and reliability depend largely on the skills of the researcher – a person, fallible to differing degree, who observes, questions and records, while at the same time modifying his or her observation, interview and recording tools ‘from one field trip to the next’ (Miles and Huberman, 1984a: 46). Thus, reliability is assessed partly by comparing the results of different researchers, when there are several of them, and partly through the work of coding raw data obtained through interviews, documents or observation (see Chapter 16). Different coders are asked to analyze data using a collection of predetermined categories and in accordance with a coding protocol. Inter-coder reliability is then assessed through the rate of agreement between the different coders on the definition of the units to code and their categorization. This reliability can also be calculated from the results obtained by a single coder who has coded the same data at two different periods, or by two coders working on the same data simultaneously.

Reliability of observations Studies based on observation are often criticized for not providing enough elements to enable their reliability to be assessed. To respond to this criticism researchers are advised to accurately describe the note­taking procedures and the observation contexts that coders should follow (Kirk and Miller, 1986), so as to ensure that different observers are assessing the same phenomenon in the same way, noting the phenomena observed according to the same norms. We can then assess the reliability of the observations by comparing how the different observers qualified and classified the observed phenomena.

To obtain the greatest similarity in results between the different observers, it is recommended that researchers use trained and experienced observers and set out a coding protocol that is as clear as possible. In particular, the protocol will have to establish exactly which elements of the analysis are to be recorded, and clearly define the selected categories.

Reliability of documentary sources Researchers have no control over the way in which documents have been established. Researchers select the documents that interest them, then interpret and compare their material. Reliability depends essentially on the work of categorizing written data in order to analyze the text (see Chapter 16), and different coders interpreting the same document should obtain the same results. An assessment of reliability is then essentially a question of determining the degree of inter-coder reliability (see the discussion on assess­ing inter-coder reliability above).

Reliability of interviews Unstructured interviews are generally transcribed and analyzed in the same way as documents; the question of reliability comes back then to determining inter-coder reliability.

In the case of more directive interviews, interview reliability can be enhanced by ensuring that all the interviewees understand the questions in the same way, and that the replies can be coded unambiguously. For this reason it is necessary to pre-test questionnaires, to train interviewers and to verify inter­coder reliability for any open questions.

3. Assessing the Validity of a Measuring Instrument

3.1. Measuring instruments used in quantitative research

We recall that validity is expressed by the degree to which a particular tool measures what it is supposed to measure rather than a different phenomenon. An instrument must also be valid in relation to the objective for which it has been used. Thus, while reliability depends on empirical data, the notion of validity is in essence much more theoretical, and gives rise to the question: ‘Valid for what purpose?’

We have seen in Section 2.1 above that the validity of a measuring instru­ment is tied to the degree of non-random error that it contains (or any bias introduced by using the tool or by the act of measuring). Improving the valid­ity of a measuring instrument then consists of reducing as far as possible the level of non-random error connected to the application of that instrument.

One type of validity by which we can assess a measuring instrument is con­tent validity: this means validating the application of a tool on the basis of a consensus within the research community as to its application. It is also useful to assess whether the tool used permits different dimensions of the phenome­non under study to be measured. In the case of quantitative instruments (par­ticularly measuring scales), the notion of instrument validity is very close to the notion of construct validity; both assess whether the indicators used (by way of the measurement scale) are a good representation of the phenomenon (see Section 1, 2.1 above).

3.2. Measuring instruments used in qualitative research

In discussing qualitative research, Miles and Huberman (1984a: 230) assert that ‘the problem is that there are no canons, decision rules, algorithms, or even any agreed upon heuristics in qualitative research, to indicate whether findings are valid’. However, the accumulation of experimental material in qualitative research has led more and more researchers to put forward methodologies which can improve the validity of qualitative tools such as observation, inter­views or documentary sources.

Improving the validity of interviews The question of the validity of interviews used in a qualitative process poses a problem, as it is difficult to assess whether this instrument measures exactly what it is supposed to measure. The fact that the questions posed concern the problem being studied is not enough to assess the validity of the interview. While it is possible to assess whether an interview is a good instrument for comprehending facts, such an assessment becomes more tenuous when we are dealing with opinions for which there is no exter­nal criterion of validity. Certain precautions exist that are designed to reduce errors or possible biases, but the subject of the validity of interviews remains debatable, raising the question of whether researchers should give priority to the accuracy of their measurements or to the richness of the knowledge obtained (Dyer and Wilkins, 1991).

Improving the validity of document analyses When an analysis can describe the contents of a document and remain true to the reality of the facts being studied, we can consider that this analysis is valid. Its validity will be that much stronger if the researcher has taken care to clearly define how categories and quantification indices are to be constructed, and to describe the categorization process in detail. We must note, however, that it is easier to show the validity of a quantitative content analysis, which aims for a more limited goal of describing obvious content, than to show the validity of a qualitative content analysis, which can have the more ambitious goals of prediction, explanation and analysis of the latent content (see Chapter 16). Validity can also be verified by comparing the results obtained through content analysis with those obtained through different techniques (interviews, measurements of attitudes, observation of behavior).

Improving the validity of observation techniques External criteria do not always exist with which to verify whether the observations really measure what they are supposed to measure. Different observation techniques are pos­sible (see Silverman, 1993), and validity depends more on the methodological system employed than on the instrument itself (Miles and Huberman, 1984a).

Source: Thietart Raymond-Alain et al. (2001), Doing Management Research: A Comprehensive Guide, SAGE Publications Ltd; 1 edition.

Internal Validity of the Research

1. Definition and Overview

Internal validity consists in being sure of the pertinence and internal coherence of the results produced by a study; researchers must ask to what degree their inferences are correct, and whether or not rival explanations are possible. They must assess, for example, whether variations of the variable that is to be explained are caused solely by the explanatory variables. Suppose that a researcher has established the causal relationship: ‘Variable A brings about the appearance of Variable B.’ Before asserting this conclusion, the researcher must ask himself or herself whether there are other factors causing the appearance of A and/or B, and whether the relationship established might not be rather of the type: ‘Variable X brings about the appearance of variables A and B.’

While internal validity is an essential test for research into causality, the con­cept can be extended to all research that uses inference to establish its results (Yin, 1989).

Testing internal validity is designed to evaluate the veracity of the connec­tions established by researchers in their analyses.

There is no particular method of ensuring the ‘favourable’ level of internal validity of a research project. However, a number of techniques (which are more tests of validity in quantitative research and precautions to take in qualitative research) can be used to assess this internal validity.

2. Techniques for Assessing Internal Validity

We will not make any distinctions between techniques used for quantitative or qualitative research. Testing for internal validity applies to the research process, which poses similar problems regardless of the nature of the study.

The question of internal validity must be addressed from the stage of designing the research project, and must be pursued throughout the course of the study.

To achieve a good standard of internal validity in their research, researchers must work to remove the biases identified by Campbell and Stanley (1966). These biases (see Table 10.2) are relative: to the context of the research (the history effect, the development effect, the effect of testing); to the collection of data (the instrumentation effect); or to sampling (the statistical regression effect, the selection effect, the effect of experimental mortality, the contamination effect).

It is essential to anticipate, from the outset, effects that might be damaging to internal validity, and to design the research so as to limit the most serious of them.

Using a specific case study as an example, Yin (1989) presents a number of tactics to strengthen internal validity. These tactics can be extended to all qual­itative research. He suggests that researchers should test rival hypotheses and compare the empirical patterns that are revealed with those of existing theoretical propositions. In this way, researchers can assess whether the rela­tionship they establish between events is correct, and that no other explanation exists.

It is then necessary to describe and explain, in detail, the analysis strategy and the tools used in the analysis. Such careful explanation increases the trans­parency of the process through which results are developed, or at least makes this process available for criticism.

Finally, it is always recommended to try to saturate the observational field (to continue data collection until the data brings no new information and the marginal information collected does not cast any doubt on the construct design). A sufficiently large amount of data helps to ensure the soundness of the data collection process.

Miles and Huberman (1984a) reaffirm many of Yin’s suggestions, and pro­pose a number of other tactics to strengthen internal validity. Researchers can, for example, examine the differences between obtained results and establish contrasts and comparisons between them: this is the method of ‘differences’. They can also verify the significance of any atypical cases – exceptions can gen­erally be observed for every result. Such exceptions may either be ignored or the researcher may try to explain them, but taking them into account allows researchers to test and strengthen their results. Researchers can also test the explanations they propose. To do so, they will have to discard false relation­ships – that is, researchers should try to eliminate the possible appearance of any new factor which might modify the relationship established between two variables. Researcher can also test rival explanations that may account for the phenomenon being studied. Researchers rarely take the time to test any explanation other than the one they have arrived at. A final precaution is to seek out contradictory evidence. This technique involves actively seeking out factors that may invalidate the theory the researcher maintains as true. Once a researcher has established a preliminary conclusion, he or she must ask whether there is any evidence that contradicts this conclusion or is incompati­ble with it.

Source: Thietart Raymond-Alain et al. (2001), Doing Management Research: A Comprehensive Guide, SAGE Publications Ltd; 1 edition.

Reliability of the Research

Doing research takes time and involves a community of researchers. However, it would be very prejudicial if the soundness or precision of results produced in this way were dependent on the individual method of each researcher in conducting a project, or again, on conditions peculiar to that study. The relia­bility of research results, over time and across a community of researchers, is an important consideration.

1. Definitions and Overview

Evaluating the reliability of research (that is, the reliability of its results) con­sists in establishing and verifying that the various processes involved will be able to be repeated with the same results being obtained by different researchers and/or at different periods. Researchers who are integrated into a scientific team must be able to convey as faithfully as possible their method of carrying out a project. This is the concept of diachronic reliability (Kirk and Miller, 1986), which examines the stability of an observation over time. Researchers must be also able to duplicate exactly a study they have previously conducted, for example, when they are conducting multi-site research over several months (synchronic reliability, Kirk and Miller, 1986, which examines the similarity of observations over the same period of time).

Kirk and Miller (1986) and Silverman (1993) both mention the quixotic reli­ability dimension of a research project’s reliability, which evaluates the circum­stances in which the same method of observation will lead to the same results. This dimension of reliability is strongly linked to the reliability of the measur­ing instrument (refer to Section 2 of this chapter).

The question of reliability concerns all operational stages of quantitative or qualitative research. These include data collection, coding, and all other pro­cesses of preparing and analyzing data, including the presentation of the results when the vocabulary or the tables used are specific to the research. It is impor­tant for researchers to precisely describe their research design, so as to aim for a higher degree of reliability. Research is a complex process (whose evolution is never linear) and often takes place over a long period of time. Researchers may forget what they have done, and why and how they did it, by the time they attempt to repeat their research or initiate a research team within a different observational field.

A social science that is situated in time, research is also a personal exercise that relies on the intuition of the researcher. It is an imaginative practice: ‘the process of theory construction in organizational studies is portrayed as imagi­nation disciplined by evolutionary processes analogous to artificial selection’ (Weick, 1989: 516). An aptitude for imagination, for perception when doing fieldwork, is not transmissible, but the process of questioning is. The degree to which a researcher will be able to duplicate a study will depend also on the accuracy of his or her description of the research process employed.

The principle techniques for attaining sound reliability in research are presented below. In general these relate to the organization and the quality of the research protocol.

2. Assessing Research Reliability

2.1. Methods common to both quantitative and qualitative research

Most importantly, researchers should always pay great attention to the com­munication of methodological information (the research process) from one researcher to another, or from one observational field to another. The different stages in the research should be clearly described, including discussion of the choice of observational field, the methods used in the collection and analysis of data, and the steps taken to control the effect the researcher may have on the observational field.

There must be a concern at all times to control the effect of the researcher on the observational field, and not only in the case of the solitary qualitative researcher. In fact, in quantitative research, the administration of a questionnaire can be disrupted by the attitude of a researcher who appears, for example, to be hurried, or who might be judgemental about the responses of the people being questioned. This kind of attitude cannot fail to disturb and to influence respondents.

At the same time, particular attention should also be given to certain other aspects of the research, according to its type. In the case of quantitative research, research reliability seems to depend more on the reliability of the mea­suring instrument. In the case of qualitative research, it seems to depend more on the ability of the researcher to understand and reconstruct the observational field.

2.2. Qualitative research

The reliability of qualitative research depends partly on the reliability of the measuring instrument. However, the interaction between the researcher and the observational field and the role of the researcher in administering the mea­suring instrument have a greater impact on research reliability in the case of qualitative research than quantitative, by reason of the very nature of the mea­suring instruments used (the qualitative instrument). Researchers must pay particular attention to writing concise instructions if qualitative measuring instruments are to be used by several people or at different times. They should explain how to use the instrument, how to understand questions that may be posed if respondents want further explanation before replying, how to select people to be questioned and, finally, how to take notes (extensive or pre-coded, for example) on the interviewee’s replies. These instructions can take different forms; such as a manual for the observer in the studied observational field, or as notes accompanying a guide to the interviewing technique, explaining the contents of the questionnaire and how it is to be administered. Carrying out a pre-test can be an appropriate occasion for developing these guidelines, which can also be used in the post-test. Finally, particular importance must be given to training those who will administer this measuring instrument.

The reliability of qualitative research depends mainly on the ability and honesty of the researcher in describing the entire research process employed, particularly in the phases which relate to condensing and analyzing the col­lected data (Miles and Huberman, 1984a). The operation of condensing data consists of a group of processes of selection, grouping, simplifying and trans­forming the raw data collected (Miles and Huberman, 1984a). The researcher arrives at a set of data that has been simplified, transformed and reduced in number (condensed), and the task of data analysis is made easier.

The dependence of reliability on the ability and honesty of the researcher concerns both the qualitative and the quantitative researcher. However, quan­titative research makes use of numerous techniques, statistical tools and tests which can be explained very precisely. This emphasis on the analysis process appeared for a long time to be less important to the qualitative researcher, par­ticularly as no specific analysis techniques exist for such research.

The following discussion is based on an article by Gioia and Thomas (1996), who give their readers a precise description of their research procedure in such a way that it can be reproduced. This description is interesting in that it gives a direct account of the methodical progression of the research, from the phase of data collection to data analysis. If research relies on a logical progression of analysis phases (Glaser and Strauss, 1967), an explanation of the process must account for this.

Similarly, Miles and Huberman (1984a), as well as Silverman (1993), recom­mend drawing up and using identical note-taking formats so as to compare different sites and to quickly develop a methodology for gathering raw data that is easy to repeat. Miles and Huberman (1984a) propose different techniques (in the form of a matrix presenting and analyzing data) to improve research reliability.

The use of matrices to present, reduce, and analyze qualitative data collec­ted in the field allows the researcher to increase the level of reliability of the research. But particular care should be taken to describe the reasons behind (the why) and the methods used (the how) in the construction of these matrices. The process of compiling and analyzing data then seems more precise, or ‘objective’, as it is no longer based on only a few personal and inaccessible methods used by a particular researcher, but instead is based on clearly explained methods.

All the same, it would not be extreme to recommend the inclusion in research projects of a certain amount of data relating to the researcher himself or herself (professional background, academic training, etc.).

Source: Thietart Raymond-Alain et al. (2001), Doing Management Research: A Comprehensive Guide, SAGE Publications Ltd; 1 edition.

External Validity of the Research

1. Definition and Overview

To assess the external validity of a research project we examine the possibilities and conditions for generalizing and appropriating the model to other sites. There are two facets to external validity, which we present in the following dis­cussion; these correspond to a logical progression in two stages in assessing research validity.

The researcher must first examine the degree to which results found from a sample can be generalized to the whole parent population (supposedly repre­sented by the sample, which has been established for the research at hand). It is only in a second stage that we can evaluate to what extent these results can be transferred or appropriated to the study and understanding of other obser­vational fields.

The potential to generalize from research results is a concern that is more familiar to researchers who apply a quantitative methodology than to those who use qualitative methods. Quantitative researchers are generally used to working with samples, as accessing the whole population is either too difficult or too costly, or may not even be necessary (a statistically representative num­ber of individuals of a population may be sufficient). Quantitative researchers are familiar with having to define the characteristics of the population under study. These characteristics provide them with criteria to use when selecting the units that will make up their study samples. Research results may then be extra­polated, taking certain statistical precautions, to the entire target population – and the status of these results can be established. However, this concern with the need to be able to generalize from their results should not be neglected by researchers who carry out qualitative work.

The status of the case studies conducted during a qualitative study can sometimes be poorly defined. Say, for example, that an in-depth case study has been carried out on company ‘X’ to study a process of industrial restructuring. Are we than to consider ‘X’ as a representative sample of a population of com­panies possessing similar characteristics, or confronted with identical strategic issues or, on the contrary, does it constitute a specific population? The status of the results of qualitative research is dependent on the answer to this question.

In both quantitative and qualitative research, the sample studied and the population targeted must be defined before we can determine the generaliza­tion perimeter of the results. To do this, qualitative research draws on a process of statistical generalization, whereas qualitative research draws on a process of analytical generalization (Yin, 1989).

The second facet of external validity – that of the transferability of results – concerns both work that assesses the potential to extrapolate research into other observational fields, and researchers who incorporate into their own research approach results imported from a different domain to that in which they are studying. In both of these situations researchers should always consider the possible contextual dependence of the research results they are working with. Contextual dependence is a measure of whether a result demonstrated in one observational field is dependent solely on one or more of the research variables, or whether it depends also on other characteristics particular to the studied field – in which case the research is culturally, his­torically or socially anchored to some extent to the field (contextualization). Although this problem is no impediment to research in itself, it should be taken into account when determining the possibilities or conditions for extra­polating results to other observational fields which do not necessarily present the same contextual characteristics.

This problem is very often raised in assessing the external validity of quali­tative research, when the results have been drawn from analysis of a single case or a small number of cases. Whereas qualitative research is often criticized for being too contextualized, Guba and Lincoln (1994) consider that work based on quantitative data too often favors precision to the detriment of contextualiza- tion. Transferability can be limited if the aggregate data has no particular appli­cation to practical cases in management. Quantitative researchers working with

large amounts of data should not be under the illusion that they understand the studied observational field in all its principal contextual characteristics (Silverman, 1993). Qualitative research can give invaluable information about the context from which the results are derived, and consequently about the con­texts in which these results can be used again. In more general terms, a detailed, rich and intimate knowledge of the context of their research enables researchers to estimate the possibilities of, and the conditions for, generalizing or transfer­ring their results to other settings.

Although they are often linked, the two facets of external validity discussed above (that is, generalization and transferability of results) should be distinct in each research project. Researchers may not necessarily aim to produce results that can be generalized to the entire population, nor to assess the possibilities for transferring their results to other observational fields. Or researchers may consider the question of generalization without having to consider that of the transferability of the results (and vice versa). It is important, though, for researchers to define their research objectives and, consequently, to marshal appropriate techniques and methods to ensure their results meet one or the other of these conditions of external validity.

2. Assessing External Validity

We set out, below, a number of techniques, tests or procedures (the list is not exhaustive) that can be used to improve the external validity of research results, according to whether the research is quantitative or qualitative. For both types of research we outline, where necessary, any problem areas with regard to the generalization and transferability of research results.

The external validity of a study depends essentially on the external validity of the measuring instrument used in the case of quantitative research, and of the research procedure itself in the case of qualitative research. For this reason, external validity techniques or tests differ greatly according to the nature of the research.

Before examining these techniques of improving external validity, let us point out that researchers will be far better able to ensure the external validity of their research if they take a hard look at the particularities of their observa­tional field from the outset.

In particular, researchers can include certain control variables in their mea­suring instrument, from its conception, to delimit and accurately characterize the population they are studying. By doing so they will improve the level of external validity of the results they obtained on completion of the study.

Researchers should also examine very carefully the variables they use in their study. Generalizing from research, or moving from one context to another, often implies modifying how these variables are operationalized. For example, the relationship between capacity to change and organizational size presupposes that the variable ‘size of the organization’ is to be measured. In the industrial sector, size may be measured by the turnover of the businesses under study. In the non-profit sector, a different measure will have to be devised (for example, the number of volunteers working for these organizations).

2.1. Quantitative research

The researcher must first determine the degree to which the results drawn from a sample can be taken as applying to the whole population, and to what degree these results can be compared to the norms or standards generally accepted about this population (as a result of previous studies for example). These two questions relate to the practice of statistical inference in quantitative research, and a number of statistical tests are available to researchers to answer them. These tests are discussed in Chapter 14.

When research has been carried out on a sample, researchers often hope to generalize their results to the population from which the sample has been drawn. The results of quantitative research are often presented in statistical form, to reduce the large amount of numerical data involved (percentages, means, standard deviations, etc.). To generalize from these results researchers must apply statistical generalization. Correspondingly, statistical formulae are used to evaluate results that have been generalized from a sample to a popula­tion. These formulae differ according to whether the results are in the form of a mean or a proportion. In both cases, we speak of the error margin within which the result generalized to the whole population lies. To determine this error margin, the researcher has to know the size of the sample and its confi­dence level (generally 95 per cent).

As we have shown in this chapter, the question of the transferability of results from one study to other related observational fields depends essentially on the following two factors:

  • the external validity of the measuring instrument used (this is discussed fur­ther in Section 2 of this chapter)
  • the validity of inferring from results from one population to another (this is discussed further in Chapter 14).

We emphasize that researchers should make use of appropriate statistical tests, which are called non-parametric tests, when working on small samples. Chapter 14 explains how these tests can be used during the research process to assure its external validity.

2.2. Qualitative research

When qualitative research produces figures in the form of proportions or means, the techniques we have presented above for quantitative research can equally be applied to generalize a result within a set margin of error, or to transfer results using statistical tests. The sample should in this case, however, comprise at least 30 units (companies observed, managers questioned, etc.), a number which is not abnormal in qualitative research.

However, the results of a qualitative study are generally presented in the form of a proposition or a written statement derived from qualitative data, in which case the use of statistical tests is not possible.

The passage from qualitative data, collected in a large quantity and often diverse in nature, to a conclusion in the form of a proposition of results, depends above all on a certain number of techniques of data collection, reduction (condensing) and analysis (Altheide and Johnson, 1994; Miles and Huberman, 1984a; Silverman, 1993). It depends, too, on the expertise and the experience of the researcher in collating this mass of information. For this reason, tech­niques aimed at assuring the external validity of qualitative research apply principally to the research process (Silverman, 1993). Only the researcher is really in a position to say how much the observational field has been taken into account and how he or she intends to allow for specific local factors in each case, in order to be able to generalize the results to a much greater arena. Researchers should always question their methods of working. They should examine the relationship between their research question and the broader historical and social context of their work, and give consideration to the rela­tionship between the observer, the observed and the place of observation, and to the observer’s point of view and his or her interpretation of the obser­vational field.

Two aspects of the qualitative research procedure need to be examined in more detail, however, as they have a direct bearing on the external validity of the research: the method used to select the observational field, and the method used to analyze the collected data.

A number of different techniques may be used when a researcher wishes to generalize from case study results that might be considered as idiosyncratic situations. Numerous authors recommend using several case studies (Eisenhardt, 1989; Guba and Lincoln, 1994) to vary the contextual characteristics of qualitative research and to limit or control as much as possible particularities of individual cases. A poorly thought-out choice of several cases does not always provide any real improvement to the external validity of the results. The following methods can be used to avoid this trap.

First, repeating a case study (Yin, 1989) will normally help to reach a theo­retical and literal generalization. In repeating a study, the researcher may either select a case for which the same results are predicted (literal replication) or select a case for which different results are produced, but for anticipated rea­sons (theoretical replication). The results of the qualitative study may then be compared or contrasted according to the characteristics – identical or different – of the cases available to the researcher.

For such case comparison to be effective, certain criteria (carefully chosen in line with the research question) must be included in each case, and the cases should vary in relation to these criteria. A good knowledge of the observational field is then vital when formulating these criteria – a knowledge based at the least on a detailed description of the field’s general framework and the activi­ties or actors being studied. These criteria may be determined at the outset of the study or they may be formulated as the research progresses, in relation to early results obtained.

The process of choosing different sites for case studies has to be carried out with care, as researchers can be influenced by a ‘representativeness bias’ (Miles and Huberman, 1994). Researchers sometimes have a tendency to select ‘simi­lar’ cases, so that their results converge and they avoid being temporarily thrown off the track by contradictory or unforeseen results. Researchers should always set down clearly the criteria they have used for selecting cases to study, and consider them with a critical eye; it can be useful to seek an external opin­ion on this selection.

There are no fixed rules setting a maximum number of repeated case studies below which a research study can maintain its qualitative nature, or above which the researcher must use statistical tools to deal with too great an amount of information. Although it is generally accepted that an understanding of local causality becomes crucial when there are more than 15 sites, this depends to a great extent on the researcher’s expertise in carrying out such qualitative studies.

The external validity of qualitative research depends also on the way in which the collected data is condensed and analyzed. Different techniques have been proposed (see Miles and Huberman, 1984a) with which researchers can move from a local explanation (causality) to an inter-site explanation, and reach a higher level of external validity. These techniques are based essentially on the use of data analysis matrices.

Although researchers do not always have the opportunity or the time to carry out a multi-site study, they can try to assure the external validity of their results by using paradox, or apparent contradiction (Quinn and Cameron, 1988) – by comparing their results with the work of other researchers (Eisenhardt, 1989) so as to interpret their single case study in a different way.

Source: Thietart Raymond-Alain et al. (2001), Doing Management Research: A Comprehensive Guide, SAGE Publications Ltd; 1 edition.