We have seen how supply and demand curves shift in response to changes in such variables as wage rates, capital costs, and income. We have also seen how the market mechanism results in an equilibrium in which the quantity supplied equals the quantity demanded. Now we will see how that equilib- rium changes in response to shifts in the supply and demand curves.
Let’s begin with a shift in the supply curve. In Figure 2.4, the supply curve has shifted from S to S’ (as it did in Figure 2.1), perhaps as a result of a decrease in the price of raw materials. As a result, the market price drops (from P1 to P3), and the total quantity produced increases (from Q1 to Q3). This is what we would expect: Lower costs result in lower prices and increased sales. (Indeed, gradual decreases in costs resulting from technological progress and better management are an important driving force behind economic growth.)
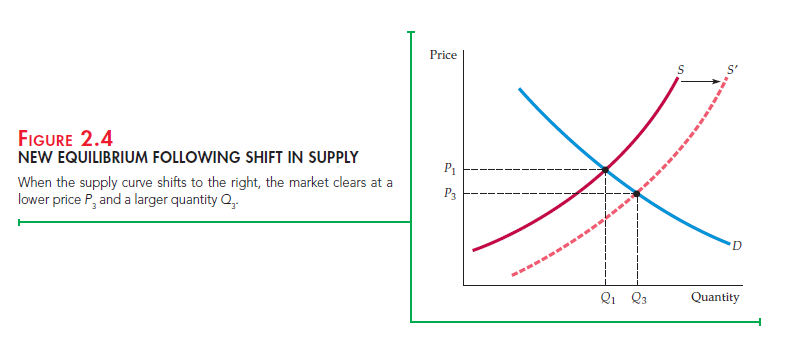
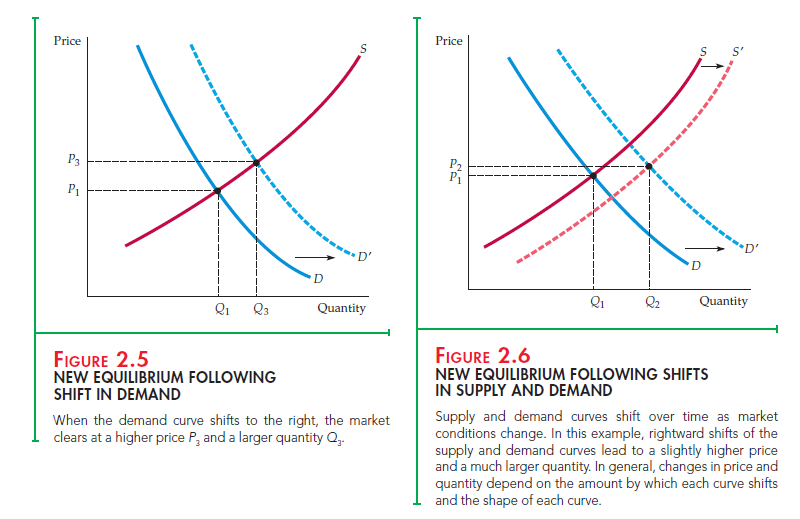
Figure 2.5 shows what happens following a rightward shift in the demand curve resulting from, say, an increase in income. A new price and quan- tity result after demand comes into equilibrium with supply. As shown in Figure 2.5, we would expect to see consumers pay a higher price, P3, and firms produce a greater quantity, Q3, as a result of an increase in income.
In most markets, both the demand and supply curves shift from time to time. Consumers’ disposable incomes change as the economy grows (or con-tracts, during economic recessions). The demands for some goods shift with the seasons (e.g., fuels, bathing suits, umbrellas), with changes in the prices of related goods (an increase in oil prices increases the demand for natural gas), or simply with changing tastes. Similarly, wage rates, capital costs, and the prices of raw materials also change from time to time, and these changes shift the supply curve.
Supply and demand curves can be used to trace the effects of these changes.
In Figure 2.6, for example, shifts to the right of both supply and demand result in a slightly higher price (from P1 to P2) and a much larger quantity (from Q1 to Q2). In general, price and quantity will change depending both on how much the supply and demand curves shift and on the shapes of those curves. To predict the sizes and directions of such changes, we must be able to character- ize quantitatively the dependence of supply and demand on price and other variables. We will turn to this task in the next section.
Generally I do not learn post on blogs, but I would like to say that this write-up very pressured me to take a look at and do it! Your writing style has been surprised me. Thanks, very great article.