The next step is to put the supply curve and the demand curve together. We have done this in Figure 2.3. The vertical axis shows the price of a good, P, again measured in dollars per unit. This is now the price that sellers receive for a given quantity supplied, and the price that buyers will pay for a given quantity demanded. The horizontal axis shows the total quantity demanded and sup- plied, Q, measured in number of units per period.
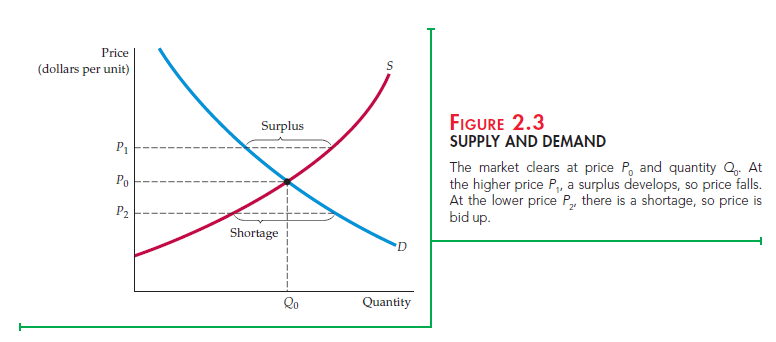
EQUILIBRIUM The two curves intersect at the equilibrium, or market-clear- ing, price and quantity. At this price (P0 in Figure 2.3), the quantity supplied and the quantity demanded are just equal (to Q0). The market mechanism is the tendency in a free market for the price to change until the market clears— i.e., until the quantity supplied and the quantity demanded are equal. At this point, because there is neither excess demand nor excess supply, there is no pressure for the price to change further. Supply and demand might not always be in equilibrium, and some markets might not clear quickly when conditions change suddenly. The tendency, however, is for markets to clear.
To understand why markets tend to clear, suppose the price were initially above the market-clearing level—say, P1 in Figure 2.3. Producers will try to pro- duce and sell more than consumers are willing to buy. A surplus—a situation in which the quantity supplied exceeds the quantity demanded—will result. To sell this surplus—or at least to prevent it from growing—producers would begin to lower prices. Eventually, as price fell, quantity demanded wouldincrease, and quantity supplied would decrease until the equilibrium price P0 was reached.
The opposite would happen if the price were initially below P0—say, at P2. A shortage—a situation in which the quantity demanded exceeds the quantity supplied—would develop, and consumers would be unable to purchase all they would like. This would put upward pressure on price as consumers tried to outbid one another for existing supplies and producers reacted by increasing price and expanding output. Again, the price would eventually reach P0.
WHEN CAN WE USE THE SUPPLY-DEMAND MODEL? When we draw and use supply and demand curves, we are assuming that at any given price, a given quantity will be produced and sold. This assumption makes sense only if a market is at least roughly competitive. By this we mean that both sellers and buyers should have little market power—i.e., little ability individually to affect the market price.
Suppose instead that supply were controlled by a single producer—a monop- olist. In this case, there will no longer be a simple one-to-one relationship between price and the quantity supplied. Why? Because a monopolist’s behav- ior depends on the shape and position of the demand curve. If the demand curve shifts in a particular way, it may be in the monopolist’s interest to keep the quantity fixed but change the price, or to keep the price fixed and change the quantity. (How this could occur is explained in Chapter 10.) Thus when we work with supply and demand curves, we implicitly assume that we are refer- ring to a competitive market.
Source: Pindyck Robert, Rubinfeld Daniel (2012), Microeconomics, Pearson, 8th edition.
I don’t unremarkably comment but I gotta tell appreciate it for the post on this amazing one : D.
I like the efforts you have put in this, thank you for all the great articles.