After the size and shape of alternative trading areas are determined, the characteristics of those areas are studied. Of special interest are the attributes of residents and how well they match the firm’s definition of its target market. An auto repair franchisee may compare opportunities in several locales by reviewing the number of car registrations; a hearing aid retailer may evaluate the percentage of the population 60 years of age or older; and a bookstore retailer may be concerned with residents’ education level.
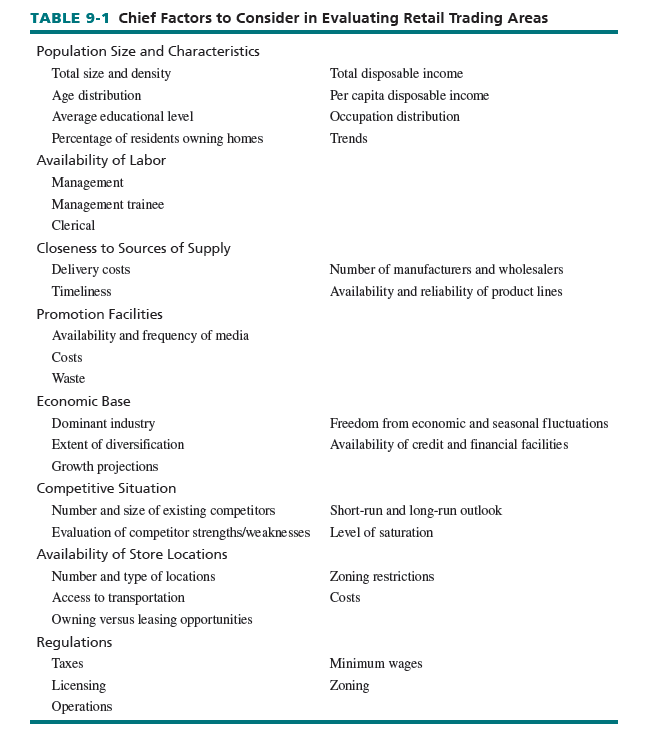
Among the trading-area factors that should be studied by most retailers are the population size and characteristics, availability of labor, closeness to sources of supply, promotion facilities, economic base, competition, availability of locations, and regulations. The economic base is an area’s industrial and commercial structure—the companies and industries that residents depend on to earn a living. The dominant industry (company) in an area is important because its drastic decline may have adverse effects on a large segment of residents. An area with a diverse economic base, where residents work for a variety of nonrelated industries, is more secure than an area with one major industry. Table 9-1 summarizes a number of factors to consider in evaluating retail trading areas.
Much of the data needed to describe an area can be obtained from the U.S. Bureau of the Census, the American Community Survey, Editor & Publisher Market Guide, Standard Rate & Data Service, regional planning boards, public utilities, chambers of commerce, local government offices, shopping-center owners, and renting agents. In addition, GIS software shows data on potential buying power in an area, the location of competitors, and highway access. Both demographic and lifestyle information may also be included in this software.
Although the yardsticks in Table 9-1 are not equally important in all location decisions, each should be considered. The most important yardsticks should be “knockout” factors: If a location does not meet minimum standards on key measures, it should be immediately dropped from further consideration.
These are examples of desirable trading-area attributes, according to these two retailers:
- Duluth Trading Company (www.duluthtrading.com), the Wisconsin-based omnichannel retailer of inventive and functional workwear for men and women, has evolved from a small mailorder business to a national retailer with nine stores and two outlets, and is expanding to other states. Duluth Trading analyzes dozens of markets to identify those with the strongest network potential based on trading-area analysis, customer segmentation, and proprietary retail modeling. Requirements for a Duluth store include a 10,000- to 15,000-square-foot space with a prominent interstate in the vicinity as well as access and visibility from a freeway, preferably near other male-oriented stores, with ample and convenient parking. Furthermore, to support its positioning that shopping at Duluth is an experience not just a purchase, it seeks “special, character-filled places and spaces, including downtown heritage locations suitable for renovation.”14
- Texas-based Container Store (www.containerstore.com) sells high-end storage and organization products. It notes that one bad store location imposes “costs for 5 to 15 years” and opportunity losses of almost five good stores. It uses predictive analytics with cutting-edge location intelligence data to identify optimal locations for stores. Location intelligence leverages data from multiple sources relevant to Container Store customers and its lines of business (e.g., number of people in a geographic area who drink wine or donate to charity). In addition, it uses census-based data GIS (incomes, demographics in a neighborhood, etc.); information from consumer credit-card transactions (for example, annual spending in various product categories in an area); social-media information from LinkedIn (jobs and skills within an area) and Facebook (opinions of businesses in the area); mobile beacon data from telecommunications companies on when and how often consumers visit stores in a neighborhood; and traffic density information (how long customers may sit in traffic) to evaluate prospective sites. The retailer may decide not to invest in real estate at all and instead develop an online strategy.15
1. Characteristics of the Population
Knowledge about population attributes can be gained from secondary sources. They offer data on population size, households, income distribution, education, age distribution, and more. Since Census of Population and other public sources are so valuable, we briefly discuss them next.
CENSUS OF POPULATION The Census of Population supplies a wide range of demographic data for all U.S. cities and surrounding vicinities. Data are organized geographically, starting with blocks and continuing to census tracts, cities, counties, states, and regions. There are less data for blocks and tracts than for larger units due to privacy issues. The major advantage of census data is the data on small geographic units. After trading-area boundaries are set, a firm can look at data by geographic unit in an area and study aggregate data. There are also data categories helpful for retailers wanting market segmentation—including racial and ethnic data, small-area income data, and commuting patterns. Data come in many formats, including online.
The U.S. Census Bureau’s TIGER computerized database contains extremely detailed physical breakdowns of areas in the United States. The database has digital descriptions of geographic areas (area boundaries and codes, latitude and longitude coordinates, and address ranges). Because TIGER data must be used in conjunction with population and other data, GIS software is necessary. As noted earlier in this chapter, private firms have devised location analysis programs, based largely on TIGER. These firms also usually project data to the present and into the future.
Major drawbacks of the Census of Population are that it is done only once every 10 years and all data are not immediately available. The last full set of U.S. census data is the 2010 Census of Population, with data released in phases from 2011 through 2013. Thus, census material can be dated and inaccurate. Other sources, such as municipal building departments or utilities, state governments, other Census reports (such as the Current Population Survey), and projections by private firms such as Dun & Bradstreet must be used to update Census of Population data.
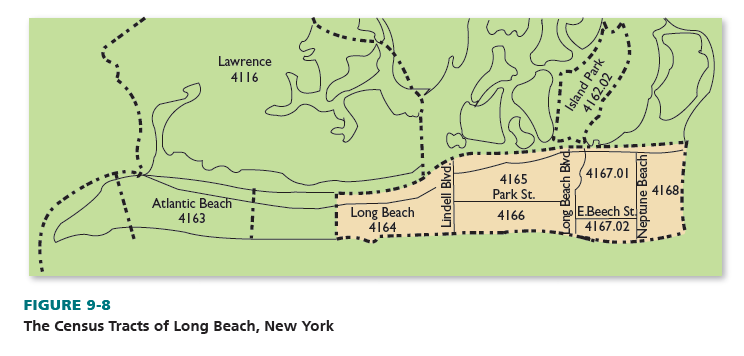
The value of the Census of Population’s actual 2010 census tract data can be shown by an illustration of Long Beach, New York, which is 30 miles east of New York City on Long Island’s south shore. Long Beach includes the six census tracts highlighted in Figure 9-8: 4164, 4165, 4166, 4167.01, 4167.02, and 4168. Although tract 4163 is contiguous with Long Beach, it represents another community. Table 9-2 shows various population statistics for each Long Beach census tract. Overall, Long Beach is above average in most demographics. However, resident attributes in each tract do differ; thus, a retailer may locate in one or more tracts but not in others.
Suppose a local bookstore wants to evaluate two potential trading areas based on the demographic data of the census tracts described in Table 9-2. Trading-area A corresponds with tracts 4164 and 4166. Area B corresponds to tracts 4167.01 and 4168. Population data for these areas (extracted from Table 9-2) are presented in Table 9-3. Area A is somewhat different from Area B, despite their proximity:
- The population in Area B is 20 percent larger.
- Although the population in both areas fell from 2000 to 2010, Area B dropped by a smaller percentage.
- In Areas A and B, the percentage aged 25 and older with college degrees is about equal.
- The annual median income and the proportion of workers who are managers or professionals are a bit higher for Area B.
The bookstore would have a tough time selecting between the areas because they are so similar. Thus, the firm might also consider the location of the sites available in Area A and Area B, relative to the locations of its existing stores, before making a final decision. It should also consider the differences between the census tracts in each proposed location. For example, in Area A, a much lower percentage of people are college graduates in tract 4164 than tract 4166.
OTHER PUBLIC SOURCES There are many other useful, easily accessible public sources for current population information, in addition to the Census of Population—especially on a city or county basis. These sources typically update their data annually. They also provide some data not available from the Census of Population—total annual retail sales by area, annual retail sales for specific product categories, and population projections. The biggest disadvantage of these sources is their use of geographic territories that are often much larger than a store’s trading area and that cannot be broken down easily.
One newer national source of annual population data is the American Community Survey, which provides “demographic, social, economic, and housing data” for about 1,000 geographical areas. The survey has an excellent, user-friendly Web site (www.census.gov/acs/www). On the state and local levels, public data sources include planning commissions, research centers at public universities, county offices, and many other institutions.
Let us demonstrate the usefulness of public sources through the following example. (Note: We obtained all of the information for our example on the Internet—free!)
Suppose a prospective new car dealer investigates three counties near Chicago: DuPage, Kane, and Lake. The dealer decides to focus on one source of data available in print and online versions: Northern Illinois Market Facts (prepared by the Center for Government Studies, Northern Illinois University). Table 9-4 lists selected population and retail sales data for these counties.
What can the dealer learn? DuPage is by far the largest county; Kane is the smallest. Yet, the population growth rate from 2000 to 2010 was much higher for Kane. Lake has the highest median household income; DuPage has more adult college graduates. Per capita, DuPage residents account for 60 percent more retail sales than Kane residents and 21 percent more than Lake’s. Lake and DuPage residents both allot more than one-fifth of spending to autos and gas stations; Kane residents account for the highest percentage of retail spending at apparel and food stores.
A Cadillac dealer using the data might select DuPage or Lake; a Ford dealer might choose Kane. But because the data are broad, several subsections of Kane may really be better choices to subsections in DuPage or Lake for the Cadillac dealer. Competition in each area also must be noted.
A location decision for a fast-food franchise often requires less data than for a bookstore or an auto dealer. Fast-food franchisors often seek communities with many people who live or work within three or four miles of their stores. But bookstore owners and auto dealers cannot locate merely based population density; they must consider a more complex set of population factors.
ECONOMIC BASE CHARACTERISTICS
The economic base reflects a community’s commercial and industrial infrastructure and residents’ sources of income. A firm seeking stability normally prefers an area with a diversified economic base (a large number of nonrelated industries) to one with an economic base keyed to a single major industry. The latter area is more affected by a strike, declining demand for an industry, and cyclical fluctuations.
In assessing a trading area’s economic base, a retailer should investigate the percentage of the labor force in each industry, transportation, banking facilities, the impact of economic fluctuations, and the future of individual industries (firms). Data can be obtained from such sources as Easy Analytic Software, Editor & Publisher Market Guide, regional planning commissions, industrial development organizations, and chambers of commerce.
Easy Analytic Software (www.easidemographics.com) offers several inexpensive economic reports. It also produces “Census 2010 Reports” that can be downloaded free (after a simple sign-in), including Quick Reports, Quick Tables, Quick Maps, Site Analysis, Rank Analysis, and Profile Analysis.
Editor & Publisher Market Guide offers annual economic base data for cities, including employment sources, transportation networks, financial institutions, auto registrations, newspaper circulation, and shopping centers. It also has data on population size and total households. The data in this guide cover broad geographic areas. The bookstore noted earlier might find the data on shopping centers to be helpful. The auto dealer would find the information on the transportation network, the availability of financial institutions, and the number of passenger cars to be useful. Editor & Publisher Market Guide is best used to supplement other sources.
2. The Nature of Competition and the Level of Saturation
A trading area may have residents who match desired characteristics of the desired market and a strong economic base, yet be a poor site for a new store if competition is too intense. A locale with a small population and a narrow economic base may be a good place if competition is less.
When examining competition, these factors should be analyzed: the number of existing stores, the size distribution of existing stores, the rate of new store openings, the strengths and weaknesses of all stores, the short-run and long-run trends, and the level of saturation.
Over the past 30 years, more U.S. retailers have entered foreign markets due to not as much competition. That is why Walmart is now in 28 countries, including Argentina, Brazil, China, Mexico, and Nigeria; Home Depot is in Canada, Guam, Mexico, and the Virgin Islands; and Baskin-Robbins has stores in Australia, Greece, Indonesia, Malaysia, Russia, and Thailand. Yet, in the future, even these locales may become oversaturated due to all the new stores. Furthermore, although the Northeast population in the United States has been declining relative to the Southeast and the Southwest—and is often considered to be saturated with stores—its high population density (the number of persons per square mile) is crucial for retailers. According to the 2010 U.S. Census, in New Jersey, there were 1,196 people per square mile; in Massachusetts, 840; in Florida, 351; in Louisiana, 105; in Arizona, 57; and in Utah, 34.
An understored trading area has too few stores selling a specific good or service to satisfy the needs of its population. An overstored trading area has so many stores selling a specific good or service that some retailers cannot earn an adequate profit. A saturated trading area has the proper amount of stores to satisfy the needs of its population for a specific good or service, and to enable retailers to prosper.
Despite the large number of areas in the United States that are overstored, there still remain plentiful opportunities in understored communities. In some product categories, such as furniture, there can be a devastating plunge in sales and store closings in many areas during a housing recession. An economic recovery, low interest rates, improving employment, and rising home sales can stoke demand for household furniture. Today, new furniture stores are opening at an unprecedented rate in understored areas due to 83 million Millennials at their peak spending age and 76 million Baby Boomers who need new furniture appropriate for downsized homes and lifestyles.16
MEASURING TRADING-AREA SATURATION Because any trading area can support only a given number of stores or square feet of selling space per goods/service category, these ratios can help quantify retail store saturation:
Number of persons per retail establishment
- Average sales per retail store
- Average sales per retail store category
- Average store sales per capita or household
- Average sales per square foot of selling area
- Average sales per employee
The saturation level in a trading area can be measured against a goal or compared with other trading areas. An auto accessory chain could find that its current trading area is saturated by computing the ratio of residents to auto accessory stores. On the basis of this calculation, the owner could then decide to expand into a nearby locale with a lower ratio rather than to add another store in its present trading area.
Data for saturation ratios can be obtained from retailer records on its performance, city and state records, phone directories, surveys, economic census data, Editor & Publisher Market Guide, County Business Patterns, trade publications, and other sources. Sales by category, population size, and number of households per market area can be found with other sources.
When investigating an area’s saturation for a specific good or service, ratios must be interpreted carefully. Differences among areas are not always reliable indicators of saturation. For instance, car sales per capita are different for a suburban area than an urban area because suburbanites have a much greater need for cars. Each area’s level of saturation should be evaluated against distinct standards—based on optimum per-capita sales figures in that area.
In calculating saturation based on sales per square foot, a new or growing retailer must take its proposed store into account. If that store is not part of the calculation, the relative value of each trading area is distorted. Sales per square foot decline most if new outlets are added in small communities. The retailer should also consider if a new store will expand the total consumer market for a good or service category in a trading area or just increase its market share in that area without expanding the total market.
Next are three examples of how retailers factor trading-area saturation into their decisions:
- Urban Outfitters (www.urbn.com) is an omnichannel lifestyle specialty retailer that operates Urban Outfitters (average store 9,000 square feet); Free People (average store 1,800 square feet); Anthropologie, Terrain, and BHLDN (average store 7,000 square feet); as well as E-commerce Web sites, mobile applications, and catalogs. It competes with online and offline stores, including those that sell its wholesale Free People products and chain fashion specialty and department stores in competitive domestic and international markets. Declines in discretionary spending on fashion, overstored U.S. retail space (where there is five times more space per person compared to that of Great Britain, France, and Japan),17 and more comparison shopping online can force markdowns—a promotional sales environ- ment—that negatively affect profit margins.
- The retail drugstore industry is highly competitive. Prescription drug sales account for more than half of sales revenues in the industry, but profit margins are low due to insurers and Medicare/Medicaid. Rite Aid (riteaid.com), the third-largest drugstore chain (with 4,560 stores) competes with other retail drugstore chains, independently owned drugstores, supermarkets, mass merchandisers, discount stores, wellness offerings, dollar stores, and mail-order pharmacies. Consolidation in the drugstore industry, the aggressive discounting of generic drugs by supermarkets and mass merchandisers (e.g., Walmart), and the increase of promotional incentives to drive prescription sales further increase competitive pressures. To expand overall profitability and higher market share, Rite Aid acquired pharmacy benefit manager (PBM) Envision Rx to access prescription files to see what are likely to be customer generators for higher margin “front-end” (e.g., nonprescription) goods and services (such as photo printing) and mini-clinics in stores. Rite Aid is rebuilding its real-estate portfolio by adding stores to fill out understored trading areas, in addition to store remodels and relocations.18
- Marketing Guidebook (www.marketingguidebook.com) has data for retailers selling food—including population size, number of households, total food store sales, number of food stores by type of retailer (such as supermarkets versus membership clubs), and more—that can be used to measure the level of saturation by U.S. city and community.
Source: Barry Berman, Joel R Evans, Patrali Chatterjee (2017), Retail Management: A Strategic Approach, Pearson; 13th edition.
I was studying some of your content on this site and I think this website is real informative ! Continue putting up.