Net income is often used by investors and creditors in evaluating a company’s profitability. However, net income by itself is difficult to use in comparing companies of different sizes. Also, trends in net income may be difficult to evaluate if there have been significant changes in a company’s stockholders’ equity. Thus, the profitability of companies is often expressed as earnings per share.
Earnings per common share (EPS), sometimes called basic earnings per share, is the net income per share of common stock outstanding during a period.11 Corporations whose stock is traded in a public market must report earnings per common share on their income statements.
Earnings per share is computed as follows:

If a company has preferred stock outstanding, any preferred dividends are subtracted from net income. This is because the numerator represents only those earnings available to the common shareholders.
To illustrate, the following data (in thousands) were taken from recent financial statements of Google:
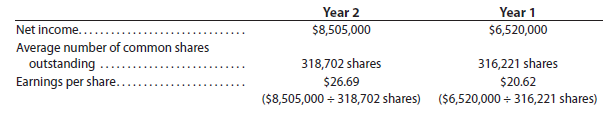
Google had no preferred stock outstanding; thus, no preferred dividends were subtracted in computing earnings per share. As shown above, Google’s earnings per share increased from $20.62 in Year 1 to $26.69 in Year 2. An increase in earnings per share is generally considered a favorable trend.
Earnings per share can be used to compare two companies with different net incomes. For example, the following data (in millions) were taken from a recent year’s financial statements for Goldman Sachs Group, Inc., and Wells Fargo & Company.
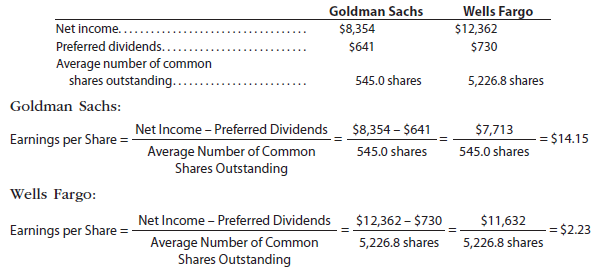
Based on earnings per share, Goldman Sachs is more profitable than Wells Fargo.
Source: Warren Carl S., Reeve James M., Duchac Jonathan (2013), Corporate Financial Accounting, South-Western College Pub; 12th edition.
Very interesting topic, appreciate it for posting.
I truly enjoy looking at on this website , it has got wonderful posts.