The ability to convert assets into cash is called liquidity, while the ability of a business to pay its debts is called solvency. Two financial measures for evaluating a business’s short-term liquidity and solvency are working capital and the current ratio.
Working capital is the excess of the current assets of a business over its current liabilities, as shown below.
Working Capital = Current Assets – Current Liabilities
Current assets are more liquid than long-term assets. Thus, an increase in a company’s current assets increases or improves its liquidity. An increase in working capital increases or improves liquidity in the sense that current assets are available for uses other than paying current liabilities.
A positive working capital implies that the business is able to pay its current liabilities and is solvent. Thus, an increase in working capital increases or improves a company’s short-term solvency.
To illustrate, NetSolutions’ working capital at the end of 2013 is $6,355 as computed below. This amount of working capital implies that NetSolutions is able to pay its current liabilities.
Working Capital = Current Assets – Current Liabilities = $7,745 – $1,390 = $6,355
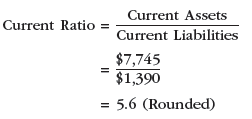
The current ratio is another means of expressing the relationship between current assets and current liabilities. The current ratio is computed by dividing current assets by current liabilities, as shown below.
![]()
To illustrate, the current ratio for NetSolutions at the end of 2013 is 5.6, computed as follows:
The current ratio is more useful than working capital in making comparisons across companies or with industry averages. To illustrate, the following data (in millions) were taken from recent financial statements of Electronic Arts Inc. and Take-Two Interactive Software, Inc.
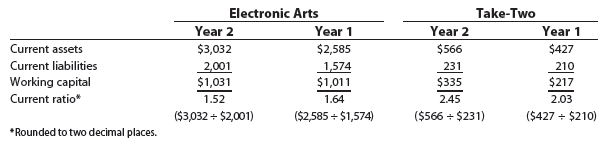
Electronic Arts is larger than Take-Two and has Year 2 working capital of $1,031 as compared to Take-Two’s Year 2 working capital of $335. Such size differences make comparisons across companies difficult. In contrast, the current ratio allows comparability across companies.
To illustrate, Electronic Arts has over three times more working capital ($1,031) than does Take-Two ($335). However, by using the current ratio the changes in liquidity of both companies can be directly compared. Specifically, Electronic Arts’ current ratio declined from 1.64 to 1.52, or 0.12. In contrast, Take-Two’s current ratio increased by 0.42 from 2.03 to 2.45. Thus, while Electronic Arts’ liquidity declined in Year 2, Take-Two’s short-term liquidity improved.
Source: Warren Carl S., Reeve James M., Duchac Jonathan (2013), Corporate Financial Accounting, South-Western College Pub; 12th edition.
I’ll right away grab your rss feed as I can not find your email subscription link or newsletter service. Do you have any? Please let me know so that I could subscribe. Thanks.