Much research has been done on scheduling with constrained resources, and the findings verify what was expected—projects are completed faster when there are fewer of them struggling for attention from a limited set of facilities (Adler, Mandelbaum, Nguyen, and Schwerer, 1996). More recently, in the book Critical Chain (1997) Eliyahu Goldratt
applies his Theory of Constraints—so brilliantly developed in his famous book, The Goal (Goldratt and Cox, 1992)—to the constrained resource problem. While Goldratt’s focus in the Critical Chain is on a single project with multiple demands on a scarce resource, the logic extends to the multiproject case without alteration. PMBOK covers the critical chain in Chapter 6 on Project Time Management.
In the following few pages you will note that the exposition focuses mainly on scheduling. But isn’t this chapter supposed to be about resource usage? It should be quite clear by now that resource usage and project schedules are inextricably bound together. The technological necessities that force schedules to be ordered in very specific ways simultaneously force resources to be used in very specific ways. To schedule work is also to schedule resource usage. If technology is the prime force behind scheduling the activities of a project, resource availability constrains all solutions to the scheduling problem.
To begin our discussion of Goldratt’s approach, imagine for the moment that you are sitting in a room full of people with extensive experience as both project team members and project managers. Now imagine the responses you would hear if the group were asked the question: “What things bugged you most about the projects you have been involved with?” Typical of the responses that we have gotten to that question are:
- Project due dates are too often unrealistic.
- There are too many changes made in the project’s scope.
- Key resources and data are often unavailable when needed.
- The budget is frequently unrealistic and therefore often exceeded.
- It seems like my project is always in competition for resources with other projects.
One interesting observation is that these same issues are raised regardless of the organizational context. Thus we hear strikingly similar complaints regardless of whether the group is referring to a construction project, a software development project, a project to develop an advertising campaign, or an R&D project. Hussain and Wearne (2005) asked more than 1000 project managers to identify the “greatest problem of project management,” a subtly different question than we asked, and they found that project “organization,” “resource,” and “time” issues were paramount. (“Change in scope was ranked 11th in their research.) Based on these findings, it is not farfetched to conclude that the causes of these problems are generic to all types of projects. As we have discussed throughout this book, one of the primary roles of the PM is effectively trading off scope, cost, and time. Referring back to the lists of complaints, it can be seen that each issue (excepting “organization”) deals with one or more of the three primary project objectives.
Given our conclusion that the problems encountered when managing projects are strongly related to the need to trade off one project objective for another, a natural question arises about the extent to which the need to make these trade-offs are caused by human decisions and practices. In other words, can more effective project management minimize the occurrence of these problems? To investigate this issue, let’s examine the complaint regarding unrealistic due dates in more detail.
One way to investigate this issue is to see if we can identify any generally accepted practices that would tend to cause the shared perception of many project workers that project due dates are often set too optimistically. To make our discussion more concrete, consider the three AOA network diagrams shown in Figure 6-17. The primary difference between the three diagrams is the degree of interdependence across the paths. In scenario 1, there is only a single path. In scenario 2, the path B-C-D-E is preceded by three activities: A1, A2, and A3. Therefore, the completion of path B-C-D-E depends on which of its three preceding tasks takes the longest. In scenario 3 there are two completely independent paths each consisting of five tasks.

Assume that as project manager you are told that all of the tasks in the three network diagrams require 10 days to complete. What completion time would you calculate for each project? If you assume that the activity times are known with certainty, then all three projects would have the same duration of 50 days. If you find this result somewhat unsettling, you are in good company. Thinking about it intuitively, how can a simple project like scenario 1 with a single path and only five activities have the same duration as scenario 2 with three paths and seven activities, or with scenario 3 with two paths and ten activities?
Part of the problem is our assumption that the activity times are known with certainty. To investigate this further, let’s assume that all activity times are normally distributed with a mean of 10 days and standard deviation of three. The results of simulating the completion of the three projects 200 times each are summarized in Table 6-5.
As you can see from Table 6-5, removing the assumption that the activity times are known with certainty leads to quite different results. Scenario 1’s average duration was slightly higher than the 50 we calculated earlier under the assumption of deterministic time estimates. To a large extent with this linear structure and with our assumption of normally distributed activity times, activities that take less than the expected time tend to cancel out the variability of activities that take more than the expected time, resulting in an overall average completion time that is close to the expected completion time for the project. (Remember, in Chapter 5 we discovered that this canceling out rarely happens in the real world, because activities may start late or on time, but rarely start early because resources are usually not available before the activity’s earliest start time.) Also observe that the more interdependent scenarios 2 and 3, on average, take even longer than scenario 1 and that their minimum times are significantly longer than scenario 1’s minimum time.
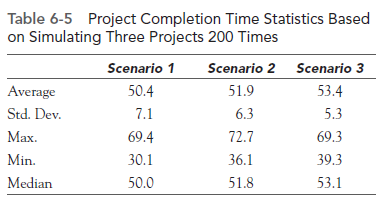
Most important, note that while the average completion times of the projects are still close to 50, this is simply the average project completion time after simulating the execution of each project 200 times. That is, approximately 50 percent of the time the projects will be completed in less than 50 days and 50 percent of the time the projects will be completed in more than 50 days under the reasonable assumption that the distribution of project completion times follows a symmetrical distribution. (Note that here we are referring to the distribution of project completion times as being symmetrical, not the project activity times.) In other words, had we determined the project duration based on the assumption that the activity times are known with certainty (when they were actually probabilistic), we would incur a greater than 50 percent chance that the actual project duration would exceed this estimate. How would you like to have responsibility for a project that has less than a 50 percent chance of being completed on time? This example clearly demonstrates how the commonly made assumption of known activity times in practice can lead to quite unrealistic project deadlines.
It is important to point out that the results would have been even more dramatic had the activities required some common resources. Similarly, the results would have been more dramatic and realistic had a nonsymmetrical distribution been used to model the activity times. Why, you might ask, would a nonsymmetrical distribution more realistically model the activity times? Suppose you scheduled a status meeting to last 20 minutes. Is there any chance the meeting will last 40 minutes longer than expected, or 60 minutes? What about 40 minutes less, or -20 minutes?
1. Estimating Task Times
Based on the discussion to this point and assuming that project workers have a general desire to be recognized for good performance, what do you imagine project workers do when they are asked to provide time estimates for tasks if they will be held responsible for actual task duration? Do you think they give an estimate that they believe provides them with only a 50 percent chance of being met? Or, more likely, do you imagine they inflate or pad their estimate to increase the likelihood of successfully completing the task on time? What would you do?
If you are like most people, you would inflate your time estimate. Unfortunately, inflated time estimates tend to create even more problems. First, inflating the time estimate has no impact on the actual probability distribution of completing the activity. Second, what do you imagine happens in cases when a project team member finishes early? All too often, the team member believes that it is in his or her best interest to remain silent about completing activities in less than the allotted time so that future time estimates are not automatically discounted by management based on a track record of early task completions. Moreover, there are sometimes penalties or additional costs associated with early completion, such as the need to store partially finished materials because the resources required for the next activity are not yet available. Third, just as things tend to fill available closet and storage space in your home, work tends to fill available time. Thus, the work done on the task may be expanded to fill the available time, as Parkinson’s Law dictates.
Perhaps even more dangerous than the inflated estimate becoming a self-fulfilling prophecy is that, after receiving approval for a task based on an inflated time estimate, workers may perceive that they now have plenty of time to complete the task and therefore delay starting the task. As we noted in Chapter 5, Goldratt (1997) refers to this as the student syndrome, likening it to the way students often delay writing a term paper until the last minute. The problem of delaying the start of a task is that obstacles are frequently not discovered until the task has been underway for some time. By delaying the start of the task, the opportunity to cope with these obstacles and complete the task on time is greatly diminished.
In summary, we observe that the common practice of simply adding up task durations often leads to unrealistic project due dates. This is primarily the result of assuming the task times are known with certainty, and that we ignore path mergers and assume that the paths are independent. A natural consequence of this is that project team members will tend to inflate their time estimates. Inflated time estimates further compound the problem, particularly in cases where the student syndrome comes into play. In other words, this system tends to cause unethical behavior.
In our discussion we used computer simulation to investigate the impact that increasing interdependencies in a project network has on the distribution of project completion times. Crystal Ball® can also be used to investigate a variety of issues related to resource allocation. To illustrate this, let’s investigate the impact of not reporting early completion times.
2. The Effect of Not Reporting Early Activity Completion
Once again, refer to Table 5-6 and consider the project described, solved, and then simulated in Chapter 5. When simulating this problem, we suggested that you should save the spreadsheet you created because we intended to use this problem in Chapter 6. We used BetaPERT distributions to reflect the uncertainty in activity duration times. The same distributions can be used, but in order to reflect Goldratt’s contention (and ours) that early completion times go unreported (and even if they were reported, the appropriate resources would probably not be available because managers avoid gathering resources until the last moment), we can truncate the distributions so that the lower bound is equal to the most likely time estimate. In effect, this means that no time below the most likely time can be reported. The required changes are easily made.
- Open the spreadsheet for the simulation you performed for the project shown in Table 5-6.
- Click on cell A3. Then click on Define Assumption in the CB ribbon.
- The BetaPERT distribution you used for the prior simulation will appear. In the box above the Minimum box, type in the most likely time for the activity—10 days for activity a as shown in Figure 6-18. Then click on OK.
- Proceed to alter each of the activities b-h (excepting d, which is a constant) similarly.
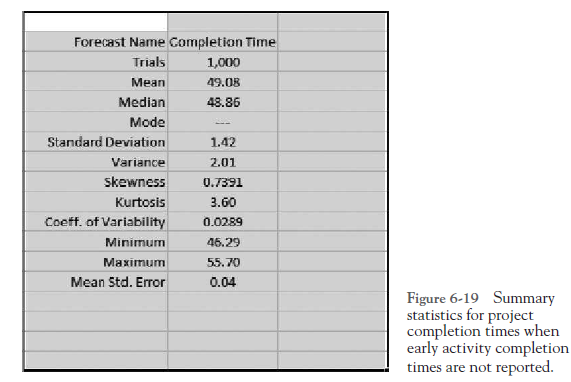
- Simulate the project 1,000 times.
Figure 6-19 shows the statistical results of the simulation. A comparison of this figure with Table 5-7 clearly shows the impact of a failure to report early activity finishes. The mean completion time is increased by approximately 2.5 percent. The time for completion with a 95 percent probability (z = 1.645) increases by 4.6 percent.
The main lesson to be learned is that single point estimates of activity duration are not adequate for planning real-world projects. For a number of reasons discussed above, the earlys and lates do not cancel out. The most likely time is, therefore, not a satisfactory substitute for a three-time estimate of activity duration.

3. Multitasking
Up to this point, our perspective has been a single project. We now investigate another problem created by conventional practice—the practice of assigning people concur’ rently to multiple projects.

When project team members are assigned to multiple projects, they have to allocate their time across these projects or multitask. Multitasking involves switching from a task associated with one project to another task associated with a different project. To illustrate this, consider the two small projects shown in Figure 6-20. The completion of each of the projects’ three tasks requires you and one additional resource. Further, the completion of each task requires 5 days.
In Figures 6-21(a) and 6-21(b), Gantt charts have been developed for two alternative ways of completing the tasks. In Gantt chart 6-21(a), you switch between projects after each task is completed, while in Gantt chart 6-21(b) you complete all of your assigned tasks for Project A before beginning any work on Project B. In both of these cases the two projects are finished in 25 days; therefore, aren’t both sequences equally desirable? The answer is absolutely not. First, while it is true that in both cases Project B is finished by time 25, in the first sequence Project A finishes in 20 days, while in the second sequence Project A finishes 5 days earlier. Therefore, the sequence shown in the second Gantt chart is preferable because it results in Project A finishing 5 days earlier with no penalty to Project B.
Even more important, our analysis overlooks another significant factor. Specifically, there is typically a penalty or cost associated with switching from working on one project to another. In your own experience as a student, is it more efficient to complete the assignment for one course and then move on to another course or is it more efficient to complete one project management homework problem, then move on to an accounting problem, then on to a statistics problem, then back to a project management problem, and so on? Obviously each time you switch to a different course you have to retrieve the appropriate textbook, find the right page, recall where you left off, and (perhaps most significantly) get into the proper frame of mind. As this example demonstrates, switching attention from project to project is likely to extend activity times. Eliminating such switching costs further increases the benefits associated with the Gantt chart shown in Figure 6-21(b).

4. Common Chain of Events
According to Goldratt, the activities discussed above lead to the following chain of events:
- Assuming that activity times are known and that the paths are independent leads to underestimating the actual amount of time needed to complete the project.
- Because the time needed to complete the project is underestimated, project team members tend to inflate their time estimates.
- Inflated time estimates lead to work filling available time, workers not reporting that a task has been completed early, and the ever-present student syndrome.
- An important caveat then becomes that safety time is not usually visible to project workers and is often misused.
- Misused safety time results in missed deadlines and milestones.
- Hidden safety time further complicates the task of prioritizing project activities.
- The lack of clear priorities likely results in poor multitasking.
- Task durations increase as a result of poor multitasking.
- Uneven demand on resources—some overloaded and others underloaded—may also occur as a result of poor multitasking.
- In an effort to utilize all resources fully, more projects will be undertaken to make sure that no resources are underutilized. (Recall the impact of this policy from our discussion of waiting lines in Section 6.5.)
- Adding more projects further increases poor multitasking.
According to Goldratt, this chain of events leads to a vicious cycle. Specifically, as work continues to pile up, team members are pressured to do more poor multitasking. Increasing the amount of poor multitasking leads to longer activity times. Longer activity times lead to longer project completion times, which ultimately lead to more projects in the waiting line.
It might have occurred to you that one way to reverse this cycle would be to add more resources. According to Goldratt, however, the appropriate response is to reduce the number of projects assigned to each person in an effort to reduce the amount of bad multitasking. Incidentally, a simple way to measure the amount of bad multitasking is to calculate the difference between the time required to do the work for a task and the elapsed time actually required to complete the task.
Determining when to release projects into the system is the primary mechanism for ensuring that the right amount of work is assigned to each person. If projects are started too early, they simply add to the chaos and contribute to poor multitasking. On the other hand, if projects are started too late, key resources may go underutilized and projects will be inevitably delayed.
Consistent with his Theory of Constraints, Goldratt suggests that the key to resolving this trade-off is to schedule the start of new projects based on the availability of bottleneck resources or Walts. Goldratt further suggests that time buffers be created between resources that feed bottleneck resources and the bottleneck resources.
While properly scheduling the start of new projects does much to address the problems associated with poor multitasking, it does little to address the problem of setting unrealistic project deadlines and the accompanying response of inflated time estimates. Relying on elementary statistics, it can be easily shown that the amount of safety time needed to protect a particular path is less than the sum of the safety times required to protect the individual activities making up the path. The same approach is commonly used in inventory management where it can be shown that less safety stock is needed at a central warehouse to provide a certain service level than the amount of safety stock that would be required to provide this same service level if carried at multiple distributed locations.
Based on this intuition, Goldratt suggests reducing the amount of safety time added to individual tasks and then adding some fraction of the safety time reduced back into the system as safety buffer for the entire project, called the project buffer. The amount of time each task is reduced depends on how much of a reduction is needed to get project team members to change their behavior. For example, the allotted time for tasks should be reduced to the point that the student syndrome is eliminated. Indeed, Goldratt suggests using activity durations where in fact there is a high probability that the task will not be finished on time.
5. The Critical Chain
Another limitation associated with traditional approaches to project management is that the dependency between resources and tasks is often ignored. To illustrate this, consider the network diagram shown in Figure 6-22. According to the figure, the activities emanating from node 1 require resource A, while the activities emanating from nodes 2 and 3 require resources C and B, respectively. Using traditional approaches to project management, two paths would be identified: A1‐C1 with a duration of 17 days and A2‐B1 with a duration of 11 days. Taking this approach a step further we would conclude that path A1‐C1 is the critical path.
The problem with this logic is that activities A1 and A2 are not truly independent as the diagram would seem to indicate since their completion requires the same resource. Based on this new insight, we see that if resource A completes activity A1 first, thereby delaying the start of A2 for 7 days, then path A1‐C1’s duration remains 17 days while path A2‐B1’s duration increases from 11 to 18 days. Likewise, if resource A completes activity A2 first, then path A1‐C1’s duration increases from 17 to 22 days while path
A2‐B1’s duration remains 11 days. (This is precisely what was considered when we examined the process of resource leveling.)
To address the need to consider both precedence relationships and resource dependencies, Goldratt proposes thinking in terms of the longest chain of consecutively dependent tasks where such dependencies can arise from a variety of sources including
precedence relationships among the tasks and resource dependencies. Goldratt coined the term critical chain to refer to the longest chain of consecutively dependent activities.
Based on this definition of the critical chain, there are two potential sources that can delay the completion of a project. One source of delay is in the tasks that make up the critical chain. The project buffer discussed earlier is used to protect against these delays (see Figure 6‑23). The second source of delay is in the tasks external to the critical chain. These tasks can also delay the completion of the project if delays in these “feeder” paths end up delaying one or more of the tasks on the critical chain. As shown in Figure 6‑23, safety time can be added to these paths as well to ensure that they do not delay tasks on the critical chain. The safety time added to chains other than the critical chain is called a feeding buffer since these paths often feed into or merge with the critical chain. Thus, the objective of feeding buffers is to ensure that noncritical chains are completed so that they do not delay tasks on the critical chain.


Clearly, activities on the critical chain should be given the highest priority. Like wise, to ensure that resources are available when needed, they should be contracted at the start of the project. It is also wise to keep these resources updated on the status of the project and to remind them periodically of when their input will be needed. Goldratt suggests reminding these resources 2 weeks before the start of their work, then 3 days prior to their start, and finally the day before they start. Since any delay of an activity on the critical chain can cause a delay of the entire project, it is important that a resource immediately switch to the task on the critical chain when needed.
The last three chapters on budgeting, scheduling, and allocating resources are the outcome of the planning process we described in Chapter 3. These subjects, taken together, are a description of what to do. Now we turn to two allied subjects: how to report what is going on and how to control it.
Source: Meredith Jack R., Mantel Jr. Samuel J., Shafer Scott M., Sutton Margaret M. (2017), Project Management in Practice, John Wiley & Sons, Inc. 3th Edition.
I always used to study piece of writing in news papers but now
as I am a user of web thus from now I am using net for content, thanks to web.