Of course, the trend is never a straight line. Then it would be too easy to tell that it had reversed. Instead, the trend is a direction rather than a line. Many doubting participants often accompany this direction. Sometimes, it can be arbitrageurs who bet against the trend or who are merely trading the spread. More likely, it is investors or traders running out of money or stock or just holding back for a little while, hoping that the price will retrace back toward their orders. In other words, the security price oscillates back and forth in smaller trends along its travel in the larger trend. This makes determining when that larger trend is reversing a difficult decision because any signs of reversal may only be for smaller trends within the larger trend. Additionally, securities occasionally “rest” during a trend and move sideways as the earlier rise or fall is “digested” by all the different players. The psychology of what causes these spurts, stops, and retracements is an interesting study by itself, but again it is irrelevant for our present discussion. We simply want to know what our trend of interest is and whether there are signs of it ending or changing direction.
Peaks and Troughs
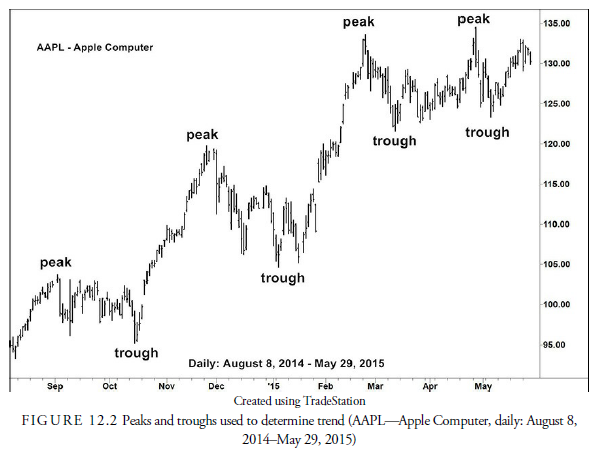
What is the simplest way to look at prices and determine the trend? The easiest is to look for peaks and troughs within a series of price oscillations. If the peaks tend to be higher than the earlier peaks, and the troughs tend to be higher than the previous troughs, the trend must be upward. As you see in Figure 12.2, it is that simple. If peaks and troughs are lower than previously, the trend must be downward. If the peaks and troughs are scattered, the trend is undeterminable, and if the peaks and troughs occur at the same relative levels, the trend must be a trading range.
It is much easier to look at price trends on a chart. As the previous chapter demonstrated, a table of data makes recognition of price order of any sort difficult. Most technicians use either bar or candlestick charts to draw lines representing trends. There are many ways to do this that are discussed later in the chapter. For now, let us begin with discussing sideways trends because they display very clearly an important technical concept called support and resistance.
Source: Kirkpatrick II Charles D., Dahlquist Julie R. (2015), Technical Analysis: The Complete Resource for Financial Market Technicians, FT Press; 3rd edition.
Some really interesting points you have written.Aided me a lot, just what I was looking for : D.