That markets trend is the basic principle underlying the theory of technical analysis. Of course, the price of the securities that are being monitored form the trend. Supporting this notion of trending prices, technical analysts have made several other assumptions that we cover briefly.
First, technical analysts assume that price is determined by the interaction of supply and demand. As basic economic theory teaches, when demand increases, price goes up, and when demand decreases, price goes down. One of the factors that determine supply and demand is buyer and seller expectations. (You do not buy a stock unless you expect it to rise in price.) Expectations result from human decisions, and decisions are based on information (perceived, accurate, or otherwise), emotions (greed, fear, and hope), and cognitive limitations such as behavioral biases, emotions, and feelings that originate from the chemistry and electrical connections within our brains. A new field of study called neurofinance, an interdisciplinary study of the application of neuroscience to investment activity, is finding remarkable connections between how our brain functions, how we make decisions, and how we invest.
Second, technical analysts assume that price discounts everything. Price discounts all information, related to the security or otherwise, as well the interpretation of expectations derived from that information. This concept was first articulated by Charles H. Dow, later reemphasized by William Peter Hamilton in his Wall Street Journal editorials, and succinctly described by Robert Rhea (1932), a prominent Dow Theorist, when writing about stock market averages:
The Averages discount everything: The fluctuations of the daily closing prices of the Dow- Jones rail and industrial averages afford a composition index of all the hopes, disappointments, and knowledge of everyone who knows anything of financial matters, and for that reason the effects of coming events (excluding acts of God) are always properly anticipated in their movement. The averages quickly appraise such calamities as fires and earthquakes.
This sounds a little like Eugene Fama’s (1970) famous statement related to the Efficient Markets Hypothesis (EMH) that “prices fully reflect all available information.” However, Fama was referring more to information on the specific security and was presuming that all interpretation of that information was immediately and rationally determined. Although technical assumptions include the price discount assumption of EMH adherents, they go far beyond that simplicity. They include not only information, both about the security and about all other outside factors that might influence that security price, but also the interpretation of that information, which might or might not be rational or directly related, and the expectations derived from that information. Interpretation, according to technical analysis, is subject to “irrational exuberance” and will “drive men to excess” as well as to a “corresponding depression” (Hamilton, 1922).
Box 2.2 Professor Andrew Lo’s Adaptive Markets Hypothesis
In an attempt to reconcile the existing but different finance ideas of efficient markets and behavioral finance, Dr. Lo (Charles E. and Susan T. Professor at the Sloan School of Management, MIT) has proposed the “Adaptive Markets Hypothesis” (2004). Lo proposes a framework based on the principles of evolution, competition, adaptation, and natural selection in which markets and players change over time. The risk-reward relationship is not constant, but changes with market conditions. Thus, investors do not seek to optimize their returns because to do so is too costly. Decisions instead are made based on experience and “best guesses,” leaving them subject to interpretative and behavioral bias—namely emotions.
As long as the markets are stable, these methods provide satisfactory results. When the economic environment changes, however, and the methods fail, the investors then have to adapt to survive. The size and strength of the different interacting player groups can cause this environmental change. An example is when the bondholders, during the 1998 Russian government debt default, sought liquidity and upset the investors in previously stable interest rate spreads, leaving them with failing and illiquid positions. Those who could rapidly adapt survived. Those who could not failed. In sum, investment strategies change and evolve; innovation is the secret of survival; and survival is the goal rather than maximizing the utility of risk versus return.
Third, an important corollary to the notion that markets trend is the technical analyst’s belief that prices are nonrandom. As we address further in Chapter 4, if prices are nonrandom, past prices potentially can be used to predict future price trends. Technical analysts reject the notion that stock prices are random.
Fourth, technical analysis assumes that history, in principle, will repeat itself (or as Mark Twain said, “History rhymes: It does not repeat”) and that humans will behave similarly to the way they have in the past in similar circumstances. This similar behavior tends to form into patterns that have predictable results. These patterns are almost never identical and are, thus, subject to interpretation, with all its own bias problems, by the technical analyst. This is the most controversial aspect of technical analysis as well as its most long standing, and it is only recently being investigated with sophisticated statistical methods (see Chapter 4).
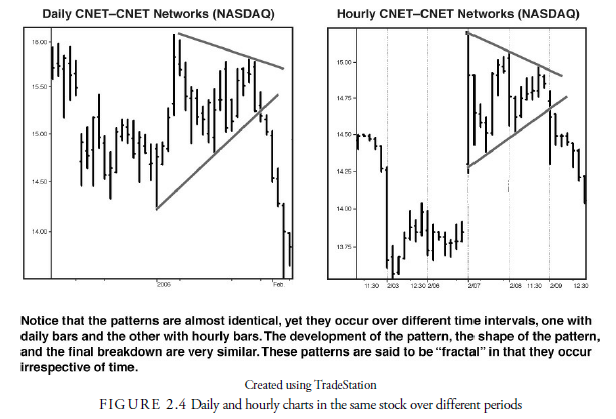
Fifth, technical analysts also believe that, like trend lines, these patterns are fractal (see Figure 2.4). Each investor or trader has a specific period of interest in which she operates. Interestingly, regardless of period, patterns occur with similar, although not identical, shapes and characteristics. Thus, an analyst who is watching five-minute bar charts will observe the same patterns that an analyst watching monthly bar charts will see. These patterns suggest that the behavior that produces them is dependent also on the participants’ period of interest. A pattern in a five-minute bar chart, for example, is the result of other traders with a five-minute bar chart time horizon. Monthly investors would have very little effect on the five-minute bar chart, as five-minute traders would have almost no effect on the monthly bar chart. Thus, each group of participants, as defined by their investment horizon, has its own world of patterns that might or might not affect each other but will be similar in shape. Pattern analysis is, therefore, universal and independent of time.
Sixth, technical analysis is also based on the notion that emotions are affected by earlier emotions through emotional feedback. If I buy a stock today and its price rises, I am happy and tell others to buy the stock, or others see its price rising and also buy it, thus causing the price to rise further. Action in the markets, therefore, is not independent but is related instead to how the market itself is behaving. Excessive feedback can cause “bubbles” when price behavior rises far out of proportion to value and can cause panics when price behavior declines sharply. Technical analysis presumes that prices will expand beyond equilibrium for emotional reasons, eventually will revert to the mean, and then expand beyond the mean in the opposite direction, constantly oscillating back and forth with excessive investor sentiment.
Source: Kirkpatrick II Charles D., Dahlquist Julie R. (2015), Technical Analysis: The Complete Resource for Financial Market Technicians, FT Press; 3rd edition.
Very interesting topic, regards for putting up.