Until now, we have discussed dollar and unit control separately. In practice, they are linked. A decision on how many units to buy is affected by dollar investments, inventory turnover, quantity discounts, warehousing and insurance costs, and so on. Three aspects of financial inventory control are covered next: stock turnover and gross margin return on investment, when to reorder, and how much to reorder.
1. Stock Turnover and Gross Margin Return on Investment
Stock turnover represents the number of times during a specific period, usually 1 year, that the average inventory on hand is sold. It can be measured by store, product line, department, and vendor. With high turnover, inventory investments are productive on a per-dollar basis; items are fresh; there are fewer losses due to changes in styles; and interest, insurance, breakage, and warehousing costs are reduced. A retailer can raise stock turnover by reducing its assortment, eliminating or having little inventory for slow-selling items, buying in a timely way, applying quick response (QR) inventory planning, and using reliable suppliers.
Stock turnover can be computed in units or dollars (at retail or cost). The choice of a formula depends on the retailer’s accounting system:
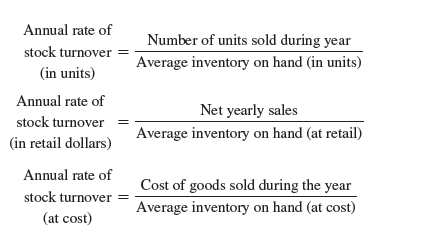
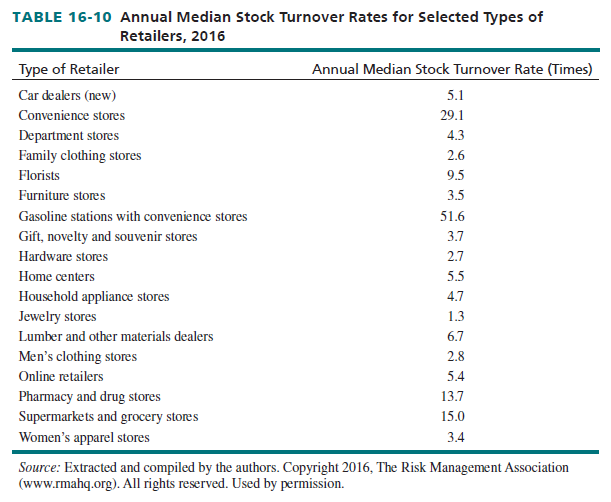
In computing turnover, average inventory for the entire period needs to be reflected. Turnover rates are invalid if the true average is not used, as occurs if a firm mistakenly views the inventory level of a peak or slow month as average. Table 16-10 shows turnover rates for various retailers. Gas stations, convenience stores, and grocers have the highest rates. They rely on sales volume for their success. Jewelry stores, hardware stores, and some clothing stores have very low rates. They require larger profit margins on each item sold and maintain a sizable assortment.
Despite the advantages of high turnover, buying items in small amounts may also result in the loss of quantity discounts and in higher transportation charges. Because high turnover might be due to a limited assortment, some sales may be lost, and profits may be lower if prices are reduced to move inventory quickly. The return on investment depends on both turnover and profit per unit. Learn more about GMROI Gross margin return on investment (GMROI) shows the relationship between the gross margin in dollars (total dollar operating profits) and the average inventory investment (at cost) by combining profitability and sales-to-stock measures:
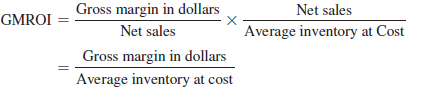
The gross margin in dollars equals net sales minus the cost of goods sold. The gross margin percentage is derived by dividing dollar gross margin by net sales. A sales-to-stock ratio is derived by dividing net sales by average inventory at cost. That ratio may be converted to stock turnover by multiplying it by [(100 — Gross margin percentage)/100].
Gross margin return on investment is a useful concept for several reasons:
- It shows how diverse retailers can prosper. A supermarket may have a gross margin of 20 percent and a sales-to-stock ratio of 15—a GMROI of 300 percent. A women’s clothing store may have a gross margin of 50 percent and a sales-to-stock ratio of 6—a GMROI of 300 percent. Both firms have the same GMROI due to the trade-off between item profitability and turnover.
- It is a good indicator of a manager’s performance because it focuses on factors controlled by that person. Interdepartmental comparisons can also be made.
- It is simple to plan and understand, and data collection is easy.
- It can be determined if GMROI performance is consistent with other company goals.
The gross margin percentage and the sales-to-stock ratio must be studied individually. If only overall GMROI is reviewed, performance may be assessed improperly.
2. When to Reorder
One way to control inventory investment is to systematically set stock levels at which new orders must be placed. Such a stock level is called a reorder point, and it is based on three factors.
- Order lead time is the period from the date an order is placed by a retailer to the date merchandise is ready for sale (received, price-marked, and put on the selling floor).
- Usage rate refers to average sales per day, in units, of merchandise.
- Safety stock is the extra inventory that protects against out-of-stock conditions due to unexpected demand and delays in delivery. It depends on the firm’s policy toward running out of items.
The formula for a retailer that does not plan to carry safety stock is shown here. It believes customer demand is stable and that its orders are promptly filled by suppliers:
Reorder point = Usage rate X Lead time
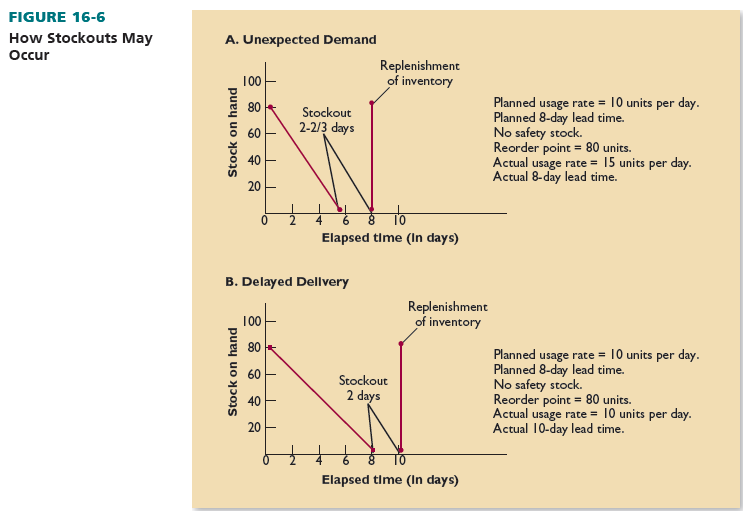
If Handy Hardware sells 10 paintbrushes a day and needs 8 days to order, receive, and display them, it has a reorder point of 80 brushes. It would reorder brushes when the inventory on hand reaches 80. By the time brushes from that order are placed on shelves (8 days later), stock on hand will be zero, and the new stock will replenish the inventory.
This strategy is proper when Handy has a steady customer demand of 10 paintbrushes daily and it takes exactly 8 days to complete all stages in the ordering process. This does not normally occur. If customers buy 15 brushes per day in a month, Handy would run out of stock in 5-1/3 days and be without brushes for 2-2/3 days. If an order takes 10 days to process, Handy would have no brushes for 2 days, despite correctly estimating demand. Figure 16-6 shows how stockouts may occur.
For a retailer interested in keeping a safety stock, the reorder formula becomes:
Reorder point = (Usage rate X Lead time) + Safety stock
Suppose Handy Hardware decides on safety stock of 30 percent for paintbrushes; its reorder point is (10 X 8) + (0.30 X 80) = 80 + 24 = 104. Handy still expects to sell an average of 10 brushes per day and receive orders in an average of 8 days. The safety stock of 24 extra brushes is kept on hand to protect against unexpected demand or a late shipment.
By combining a perpetual inventory system and reorder point calculations, ordering can be computerized and an automatic reordering system can be mechanically activated when stock- on-hand reaches the reorder point. However, intervention by a buyer or manager must be possible, especially if monthly sales fluctuate greatly.
3. How Much to Reorder
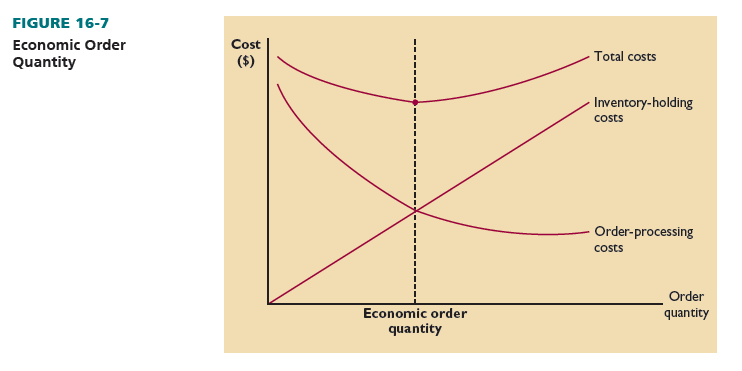
A firm placing large orders generally reduces ordering costs but increases inventory-holding costs. A firm placing small orders often minimizes inventory-holding costs while ordering costs may rise (unless EDI and a QR inventory system are used).
Economic order quantity (EOQ) is the quantity per order (in units) that minimizes the total costs of processing orders and holding inventory. Order-processing costs include computer time, order forms, labor, and handling new goods. Holding costs include warehousing, inventory investment, insurance, taxes, depreciation, deterioration, and pilferage. Economic order quantity calculations can be done by large and small firms.
As Figure 16-7 shows, order-processing costs drop as order quantity (in units) goes up because fewer orders are needed for the same annual quantity. Inventory-holding costs rise as the order quantity goes up because more units must be held in inventory and they are kept for longer periods. The two costs are summed into a total cost curve. Mathematically, the economic order quantity is:
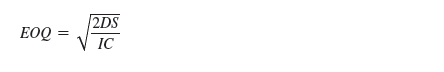
Where
EOQ = quantity per order (in units)
D = annual demand (in units)
S = costs to place an order (in dollars)
I = percentage of annual carrying cost to unit cost C = unit cost of an item (in dollars)
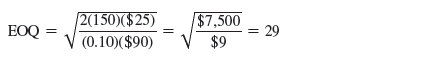
Handy estimates it can sell 150 power tool sets per year. They cost $90 each. Breakage, insurance, tied-up capital, and pilferage equal 10 percent of the costs of the sets (or $9 each). Order costs are $25 per order. The economic order quantity is 29:
The EOQ formula must often be modified to take into account changes in demand, quantity discounts, and variable ordering and holding costs.
Source: Barry Berman, Joel R Evans, Patrali Chatterjee (2017), Retail Management: A Strategic Approach, Pearson; 13th edition.
I have been absent for some time, but now I remember why I used to love this blog. Thank you, I¦ll try and check back more often. How frequently you update your site?