ICC performs a reliability analysis for two or usually more judges or observers who have rated the same somewhat subjective behavior. In our example, the mosaic pattern test was given to students; then responses to the test were scored by three different observers, raters, or judges. The scores these judges recorded were called mosaic, mosaic2, and mosaic3, respectively. We want to see if the three judges provide consistent scores in terms of the correlations among their ratings (i.e., do all three judges score the same students highly and other students low). In addition, we will find out if the three judges differ in terms of their mean ratings (i.e., are the judges equally strict or do one or two judges give more generous scores).
- What is the reliability coefficient for the three mosaic pattern test judges? Are the means of the mosaic scores for the three judges different?
To answer these questions, we will compute ICC.
- Click on Analyze → Scale → Reliability Analysis.
- Move mosaic, mosaic2, and mosaic3 to the Items
- Type “ICC for Mosaic” in the Scale Label
- Click on Statistics to open the Reliability Analysis: Statistics See Figure 3.2 if needed.
- Check Item under Descriptives for, F-test under ANOVA, Intraclass Correlation Coefficient, Two-Way Random beside Model, and Consistency beside Type.
- Click Continue, and then OK. Compare your syntax and output to Output 3.5.
Output 3.5: ICC for Three Mosaic Judges
RELIABILITY
/VARIABLES=mosaic mosaic2 mosaic3
/SCALE(‘ICC for Mosaic’) ALL
/MODEL=ALPHA
/STATISTICS=DESCRIPTIVE ANOVA
/ICC=MODEL(RANDOM) TYPE(CONSISTENCY) CIN=95 TESTVAL=0.
Reliability
Scale: ICC for Mosaic
Interpretation of Output 3.5
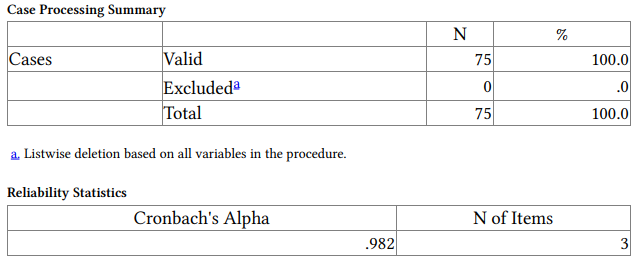
The Case Processing Summary shows that all 75 students have scores from all three judges. The Cronbach’s alpha for these three judges (called items) is .982, which we will see is the same as the average measures Intraclass Correlation Coefficient (ICC) in the last output table below.

Interpretation of Output 3.5 continued The Item Statistics table shows the mean, SD, and N for the three mosaic judges. Note that the mosaic pattern test 3 judge scores the students lower on average (26.53) than the other two judges. In the ANOVA table “Between People” refers to the different participants, not the different judges. Differences between judges are the “between items”
differences “within people.” The ANOVA table shows that F(2, 148) =4.47, p = .013, so there is a significant difference among the means of the three judges.
Examination of the means in the Items Statistics table indicates that judge 3 rated mosaic lower than did the other two judges, so a researcher might decide to use only the other two raters’ scores if all judges rated all students. However, if only one judge rated some of the participants, then it would seem reasonable, given the high reliability of the data, to use all judges’ ratings or average the judges’ ratings to get the final data to use in the study.

Interpretation of Output 3.5 continued The Intraclass Correlation Coefficient table is the key table in terms of the reliability of the ratings of the three judges. The “Average measures” indicates the reliability of the average scores across judges. This is worth knowing if you plan to average the raters’ scores to get the final rating you use and want to know how reliable the resulting data are. On the other hand, it does not give us an estimate of reliability that takes into account variability across judges. Since the latter is what we are trying to determine here, we will use the “single measures” ICC as the index of interrater reliability. Notice that the F test in this table compares the value of the intraclass correlation with the null hypothesis of no correlation (true value 0). Unsurprisingly, the correlations both differ significantly from zero, since they are over .9. The magnitude of the reliability coefficient (.947) is more important. The F test in the ANOVA table discussed above gives a more important F test to consider.
Example of How to Write About Problem 3.5
The intraclass correlation coefficient indicates that the interrater reliability for the three judges’ ratings of students’ mosaic pattern test scores was .95.
Source: Leech Nancy L. (2014), IBM SPSS for Intermediate Statistics, Routledge; 5th edition;
download Datasets and Materials.
16 Sep 2022
19 Sep 2022
15 Sep 2022
27 Mar 2023
28 Mar 2023
22 Sep 2022