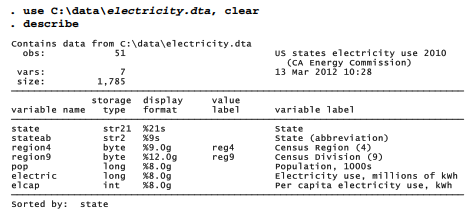
Dataset electricity.dta contains information on electricity consumption in U.S. states, from the California Energy Commission (2012).
To find the mean and standard deviation of per capita electricity use (elcap), type

This table also gives the number of nonmissing observations and the variable’s minimum and maximum values. If we had simply typed summarize with no variable list, we would obtain means and standard deviations for every numeric variable in the dataset.
To see more detailed summary statistics, type . summarize elcap, detail
. summarize elcap, detail

Percentiles: Notably the first quartile (25th percentile = 10,359), median (50th percentile = 13,388), and third quartile (75th percentile = 16,117). Because many samples do not divide evenly into quarters or other standard fractions, these percentiles are approximations.
Four smallest and four largest values, where outliers might show up.
Sum of weights: the summarize command permits frequency weights or fweight. For explanations see help weight.
Variance: Standard deviation squared (more properly, standard deviation equals the square root of variance).
Skewness: The direction and degree of asymmetry. A perfectly symmetrical distribution has skewness = 0. Positive skew (heavier right tail) results in skewness > 0; negative skew (heavier left tail) results in skewness < 0.
Kurtosis: Tail weight. A normal (Gaussian) distribution is symmetrical with kurtosis = 3. If a symmetrical distribution has heavier-than-normal tails (is sharply peaked), then kurtosis > 3. Kurtosis < 3 indicates lighter-than-normal tails.
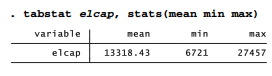
The tabstat command provides a more flexible alternative to summarize . We can specify just which summary statistics we want to see. For example,
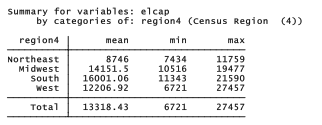
With a by(varname) option, tabstat constructs a table containing summary statistics for each value of varname. The following example gives means, minimum and maximum for per capita electricity use, separately for each of four U.S. census regions. Electricity use is relatively low in the Northeast, and much higher in the Midwest and South.
. tabstat elcap, stats(mean min max) by(reglon4)
In addition to mean, min or max, other statistics available for the stats( ) option of tabstat include the same set listed earlier for collapse or graph bar (such as count, sum, max, min, variance, sd, and pi through p99 for percentiles). Further tabstat options give control over the table layout and labeling. Type help tabstat to see a complete list.
The statistics produced by summarize or tabstat describe the sample at hand. For some purposes, although probably not with U.S. states data, we might want to construct confidence intervals suggesting inferences about a larger population. As an illustration, obtaining a 99% confidence interval for the mean of elcap:
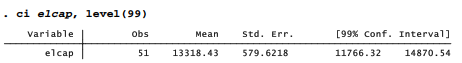
Accepting for the moment these 51 states (with the District of Columbia) as a sample, we could be 99% confident that the population mean lies somewhere in the interval from 11,766 to 14,870 kWh per person. More precisely, over many random samples, intervals constructed in this manner should contain the true population mean about 95% of the time. The level(99) option specified a 99% confidence interval. If we omit this option, ci defaults to a 95% confidence interval.
Other options allow ci to calculate exact confidence intervals for variables that follow binomial or Poisson distributions. A related command, cii, calculates normal, binomial or Poisson confidence intervals directly from summary statistics, such as we might encounter in a published article. It does not require the raw data. Type help ci for details about both of these useful commands.
Source: Hamilton Lawrence C. (2012), Statistics with STATA: Version 12, Cengage Learning; 8th edition.
3 Oct 2022
23 Sep 2022
29 Sep 2022
3 Oct 2022
3 Oct 2022
3 Oct 2022