What would happen to the price of widgets if the government imposed a $1 tax on every widget sold? Many people would answer that the price would increase by a dollar, with consumers now paying a dollar more per widget than they would have paid without the tax. But this answer is wrong.
Or consider the following question. The government wants to impose a 50-cent-per-gallon tax on gasoline and is considering two methods of collect-ing it. Under Method 1, the owner of each gas station would deposit the tax money (50 cents times the number of gallons sold) in a locked box, to be col-lected by a government agent. Under Method 2, the buyer would pay the tax (50 cents times the number of gallons purchased) directly to the government.
Which method costs the buyer more? Many people would say Method 2, but this answer is also wrong. The burden of a tax (or the benefit of a subsidy) falls partly on the consumer and partly on the producer. Furthermore, it does not matter who puts the money in the collection box (or sends the check to the government)—Methods 1 and 2 both cost the consumer the same amount of money. As we will see, the share of a tax borne by consumers depends on the shapes of the supply and demand curves and, in particular, on the relative elasticities of supply and demand. As for our first question, a $1 tax on widgets would indeed cause the price to rise, but usu-ally by less than a dollar and sometimes by much less. To understand why, let’s use supply and demand curves to see how consumers and producers are affected when a tax is imposed on a product, and what happens to price and quantity.
THE EFFECTS OF A SPECIFIC TAX For the sake of simplicity, we will consider a specific tax—a tax of a certain amount of money per unit sold. This is in contrast to an ad valorem (i.e., proportional) tax, such as a state sales tax. (The analysis of an ad
valorem tax is roughly the same and yields the same qualitative results.) Examples of specific taxes include federal and state taxes on gasoline and cigarettes.
Suppose the government imposes a tax of t cents per unit on widgets.
Assuming that everyone obeys the law, the government must then receive t cents for every widget sold. This means that the price the buyer pays must exceed the net price the seller receives by t cents. Figure 9.17 illustrates this simple accounting relationship—and its implications. Here, P0 and Q0 represent the market price and quantity before the tax is imposed. Pb is the price that buyers pay, and Pe is the net price that sellers receive after the tax is imposed. Note that Pb – Ps = t, so the government is happy.
How do we determine what the market quantity will be after the tax is imposed, and how much of the tax is borne by buyers and how much by sellers? First, remember that what buyers care about is the price that they must pay: Pb. The amount that they will buy is given by the demand curve; it is the quantity that we read off of the demand curve given a price Pb. Similarly, sellers care about the net price they receive, P. Given P, the quantity that they will produce and sell is read off the supply curve. Finally, we know that the quantity sold must equal the quantity bought. The solution, then, is to find the quantity that corresponds to a price of Pb on the demand curve, and a price of Ps on the supply curve, such that the difference Pb – Ps is equal to the tax t. In Figure 9.17, this quantity is shown as Q1.
Who bears the burden of the tax? In Figure 9.17, this burden is shared roughly equally by buyers and sellers. The market price (the price buyers pay) rises by half of the tax, and the price that sellers receive falls by roughly half of the tax.
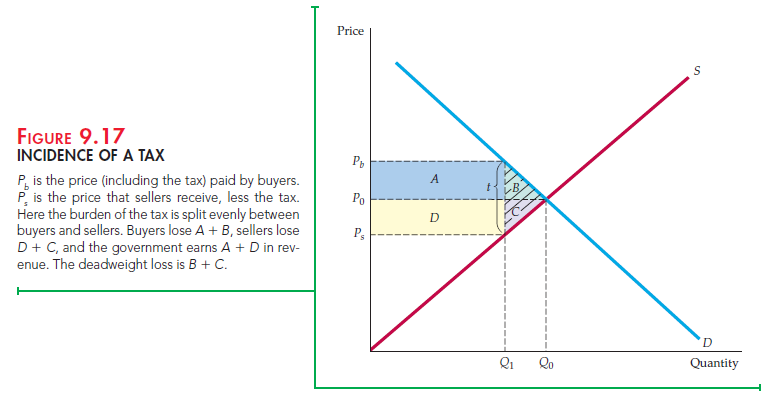
As Figure 9.17 shows, market clearing requires four conditions to be satisfied after the tax is in place:
- The quantity sold and the buyer’s price Pb must lie on the demand curve (because buyers are interested only in the price they must pay).
- The quantity sold and the seller’s price Ps must lie on the supply curve (because sellers are concerned only with the amount of money they receive net of the tax).
- The quantity demanded must equal the quantity supplied (Qb in the figure).
- The difference between the price the buyer pays and the price the seller receives must equal the tax
These conditions can be summarized by the following four equations:
If we know the demand curve QD(Pb), the supply curve QS(Ps), and the size of the tax t, we can solve these equations for the buyers’ price Pb, the sellers’ price Ps, and the total quantity demanded and supplied. This task is not as difficult as it may seem, as we will demonstrate in Example 9.7.
Figure 9.17 also shows that a tax results in a deadweight loss. Because buyers pay a higher price, there is a change in consumer surplus given by
![]()
Because sellers now receive a lower price, there is also a change in producer surplus given by
![]()
Government tax revenue is tQ 1, the sum of rectangles A and D. The total change in welfare, ACS plus APS plus the revenue to the government, is therefore -A – B – C – D + A + D = -B – C. Triangles B and C represent the deadweight loss from the tax.
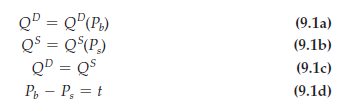
In Figure 9.17, the burden of the tax is shared almost evenly between buyers and sellers, but this is not always the case. If demand is relatively inelastic and supply is relatively elastic, the burden of the tax will fall mostly on buyers. Figure 9.18(a) shows why: It takes a relatively large increase in price to reduce the quantity demanded by even a small amount, whereas only a small price decrease is needed to reduce the quantity supplied. For example, because cigarettes are addictive, the elasticity of demand is small (about -0.4); thus federal and state cigarette taxes are borne largely by cigarette buyers
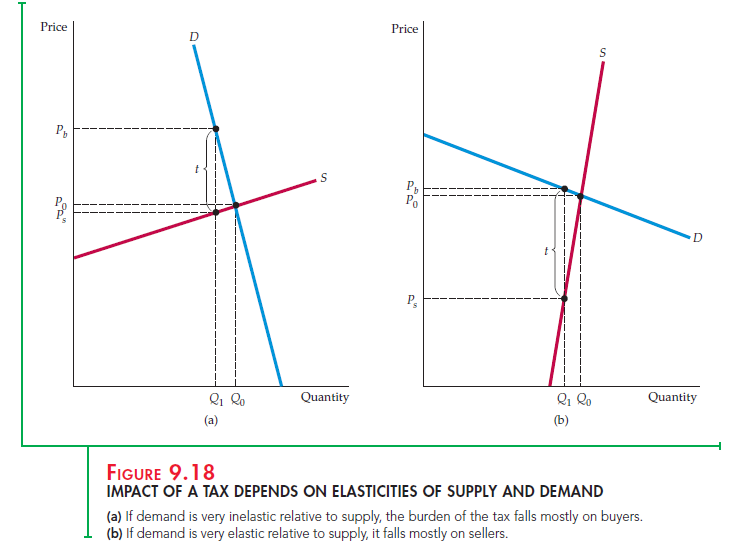
Figure 9.18(b) shows the opposite case: If demand is relatively elastic and supply is relatively inelastic, the burden of the tax will fall mostly on sellers.
So even if we have only estimates of the elasticities of demand and supply at a point or for a small range of prices and quantities, instead of the entire demand and supply curves, we can still roughly determine who will bear the greatest burden of a tax (whether the tax is actually in effect or is only under discussion as a policy option). In general, a tax falls mostly on the buyer if Ed/Es is small, and mostly on the seller if EJEs is large.
In fact, by using the following “pass-through” formula, we can calculate the percentage of the tax borne by buyers:
Pass-through fraction = Es/(Es – Ed)
This formula tells us what fraction of the tax is “passed through” to consumers in the form of higher prices. For example, when demand is totally inelastic, so that Ed is zero, the pass-through fraction is 1 and all the tax is borne by consumers. When demand is totally elastic, the pass-through fraction is zero and producers bear all the tax. (The fraction of the tax that producers bear is given by − Ed/(Es − Ed).)
The Effects of a Subsidy
A subsidy can be analyzed in much the same way as a tax—in fact, you can think of a subsidy as a negative tax. With a subsidy, the sellers’ price exceeds the buyers’ price, and the difference between the two is the amount of the subsidy. As you would expect, the effect of a subsidy on the quantity produced and consumed is just the opposite of the effect of a tax—the quantity
will increase.
Figure 9.19 illustrates this. At the presubsidy market price P0, the elasticities of supply and demand are roughly equal. As a result, the benefit of the subsidy is shared roughly equally between buyers and sellers. As with a tax, this is not always the case. In general, the benefit of a subsidy accrues mostly to buyers if Ed/Es is small and mostly to sellers if Ed/Es is large.
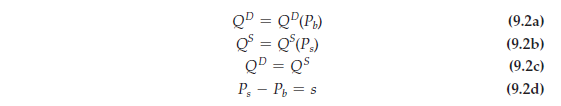
As with a tax, given the supply curve, the demand curve, and the size of the subsidy s, we can solve for the resulting prices and quantity. The same four conditions needed for the market to clear apply for a subsidy as for a tax, but now the difference between the sellers’ price and the buyers’ price is equal to the subsidy. Again, we can write these conditions algebraically:
To make sure you understand how to analyze the impact of a tax or subsidy, you might find it helpful to work through one or two examples, such as Exercises 2 and 14 at the end of this chapter.
Source: Pindyck Robert, Rubinfeld Daniel (2012), Microeconomics, Pearson, 8th edition.
This site is known as a walk-by means of for all the info you needed about this and didn’t know who to ask. Glimpse right here, and also you’ll undoubtedly discover it.