The final subject relating to trends is retracements. As mentioned and observed previously, a trend rarely follows a line without including a number of smaller trends. The smaller countertrends are called retracements, and several rules have been developed concerning them.
Retracements are always corrections to the principal trend. As prices rise, for example, in a strong uptrend, the rise is interrupted periodically by downward corrections. In an uptrend, the beginning of these corrections is always a resistance point, and the bottom of the retracement is always a support point. The lower support point is where a new trend line can be plotted from a previous support point. Thus, a retracement is a smaller trend itself and runs counter to the principal trend.
For example, consider the price movement pictured in Figure 13.12. Obviously, the principal trend for AAPL (Apple Computer) from late June is upward. However, from mid-August through mid-September, prices are trending downward in a countertrend, retracing a portion of the price gain. This retracement halts, as is often the case, at the downward trend line established before the upward trend began. Such a retracement is called a throwback and is an excellent level at which to participate in the upward trend. Not all retracements are as large. In early August, for example, a small throwback occurred right after the upward breakout through the trend line. A small throwback retracement such as this is also quite typical action after an upward breakout.
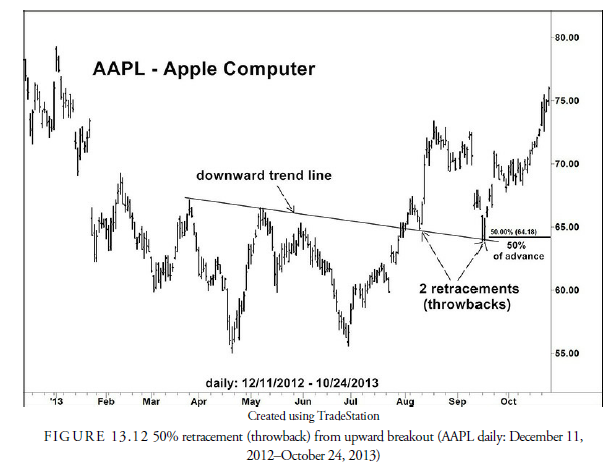
A retracement can be analyzed in the same way as the longer trend. It is, in fact, a trend in itself but with a direction opposite from the principal trend and with a shorter period and length. Within a trend, many retracements of different amounts and periods can occur. Because the end of a retracement usually is the support or resistance point for the longer trend, the length and time of a retracement can tell us something about the longer trend. For example, in a sharply rising upward trend, you would expect the retracements to be short and not “retrace” a large percentage of the earlier rise. Indeed, the general rule is that a strong upward trend requires retracements of less than 50% of the previous trend. The same is true for downward trends. Should the retracement in an upward trend decline more than 50%, the trend line in the longer upward trend would be in jeopardy. Figure 13.12 shows a 50% retracement in the upward trend from July to late August. The retracement not only stopped at the 50% retracement level but also at the earlier downward trend line, Thus, the amount of retracement indicates the larger trend’s strength.
A retracement, in a healthy trend, can also present an opportunity for the trend follower who missed the earlier stages of the trend to jump on the longer trend. A retracement, as long as it holds above the longer trend line and does not retrace more than 50%, as occurred in Figure 13.12, is usually an opportunity for the trend follower to act in the direction of the larger trend.
Unfortunately, retracements rarely reach an exact percentage. Some analysts believe that percentage retracements provide a good entry point. Many articles and books have hypothesized that in an uptrend or downtrend, prices will tend to retrace a certain percentage. The most common mentioned are 33 1/3%, 50%, 66 2/3%, and the Fibonacci percentages of 38.2% and 61.8%. The late Art Merrill, a well-respected technical analyst, in a paper published in the Journal of Technical Analysis (August 1989), found that the amount by which prices retrace in the Dow Jones Industrial Average during an advance or decline did not concentrate about any of these percentages.
Anticipating retracement levels, therefore, can be somewhat hazardous, and the trade-off between the amount of retracement desired and what may actually occur is usually unanticipated. Thus, a rough estimate from previous retracements, support and resistance zones, and the location of the longer trend line is probably the best information for an estimate rather than the mechanical percentage numbers derived from various formulas.
1. Pullbacks and Throwbacks
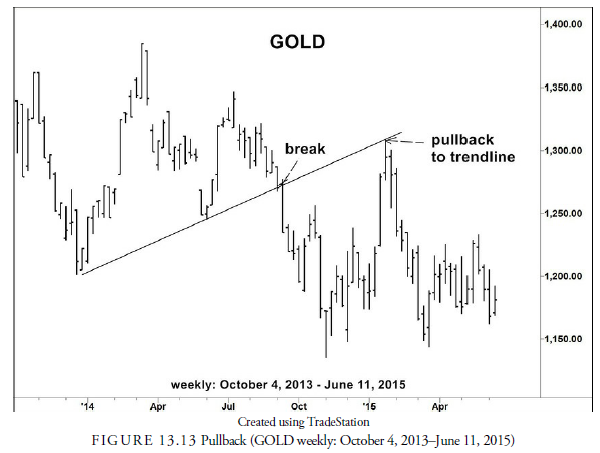
Variations of retracements that occur after a breakout, usually from a horizontal support or resistance zone but sometimes from a trend line, are called pullbacks or throwbacks depending on whether the breakout was downward or upward. When the price retraces quickly back to the breakout zone from an upward breakout, it is called a throwback, and conversely, the quick retracement from a break downward is called a pullback (Edwards and Magee, 2007). Figure 13.13 shows a pullback in the gold market. These retracement variations will become more important when we discuss chart patterns, but they often are found in any breakout, especially in one from a rectangle formation or congestion area. These retracements may not abide by normal retracement percentages if they are blocked by the support or resistance level from which they broke. They tend to be very short in time and distance but often provide a second, lesser-risk opportunity for a breakout trader to enter a position.
2. Waiting for Retracement
When a breakout occurs but a gap is not present, some traders will wait for the pullback or throwback before entering a position. To do this, they wait for the initial run from the breakout to exhaust itself, calculate a percentage—usually 50%—retracement from the breakout to the high or low, and place a limit order at that level. A breakout followed by a pullback is pictured in Figure 13.13. Studies have shown (Thom Hartle, Active Trader Magazine, March 2004) that the percentage retracement is not predictable and varies widely. Thus, these traders run the risk that the security will not retrace the percentage or will retrace the percentage and continue correcting back to the original stop level. To prevent this, once the percentage retracement level is determined and the limit order is placed, the stop is adjusted to just behind the limit order to prevent the retracement from becoming a large loss if it continues. Often the trader will also enter a partial position on the breakout and a partial position at the expected retracement level with a stop for the entire position just behind it. This way, the risk of missing the security continuing beyond its breakout without a retracement is reduced, and should the retracement occur, a full position will be entered at a lower average price.
3. Calculating a Risk/Return Ratio for Breakout Trading
Usually breakouts from support or resistance run to the next zone of support or resistance. This gives the investor or trader a price objective for the breakout. From that price objective, a risk/return ratio can be calculated. The return is the difference between the entry price and the price objective. The risk is the amount the price must go against the entry price before exited on a stop, usually some price on the other side of the breakout. Traditionally, the reward/risk ratio should be a minimum of 3:1. This gives the investor the odds of making money even when two out of three trades fail, assuming the third action provides a 3:1 gain. In Chapter 15, “Bar Chart Patterns,” and Chapter 16, “Point and Figure Chart Patterns,” we learn other methods of determining a price objective. This 3:1 guideline, however, should always be the minimum reward/risk ratio. Anything less than 3:1 increases the odds of losing money beyond acceptable amounts.
Source: Kirkpatrick II Charles D., Dahlquist Julie R. (2015), Technical Analysis: The Complete Resource for Financial Market Technicians, FT Press; 3rd edition.
I’m not that much of a internet reader to be honest but your blogs really nice, keep it up! I’ll go ahead and bookmark your site to come back in the future. Many thanks