The next step is to create a data file into which you will enter the data. If you do not have the program open, you need to log on. When you see the startup window, click the Type in data button; then you should see a blank Data Editor that will look something like Fig. 2.5. Also be sure that Display Commands in the Log is checked.
This article helps you name and label the variables. In the next section, we show you how to enter data. First, let’s define and label the first two variables, which are two 5-point Likert ratings. To do this we need to use the Variable View screen. Look at the bottom left corner of the Data Editor to see whether you are in the Data View or Variable View screen by noting which tab is white. If you are in Data View, to get to Variable View do the following:
- Click on the Variable View tab at the bottom left of your screen. This will bring up a screen similar to Fig. 2.5. (Or, double click on var above the blank column to the far left side of the Data View.)

Fig. 2.5. Blank variable view screen in the data editor.
In this window, you will see 11 columns that will allow you to input the variable name, type of variable, width, number of decimals, variable label, value labels, missing values other than blanks, columns, align data left or right, measurement type, and variable role.
Define and Label Two Likert-Type Variables
We now begin to enter information to name, label, and define the characteristics of the variables used in this chapter.
- Click in the blank box directly under Name in Fig. 2.5.
- Type recommend in this box. Notice the number 1 to the left of this box. This indicates that you are entering your first variable. [1]
- Press enter. This will insert the program’s default values for variables. You need to check to be sure these are correct for each of your variables and make changes if needed.
Note that the Type is numeric, Width = 8, Decimals = 2, Label = (blank), Values = None, Missing = None, Columns = 8, Align = right, Measure = scale, Role = input.
For this assignment, we will keep the default values for Type, Width, Columns, and Align. On the Variable View screen, you will notice that the default for Type is Numeric. This refers to the type of variable you are entering. Usually, you will only use the Numeric option. Numeric means the data are numbers. String would be used if you input words or letters such as “M” for males and “F” for females. However, it is best not to enter words or letters because you wouldn’t be able to do many statistics without recoding them as numbers. In this book, we will always keep the Type as Numeric.
We recommend keeping the Width at eight, and keeping the Columns at eight. We will always Align the numbers to the right. Sometimes, we will change the settings for the other columns.
Now let’s continue with defining and labeling the recommend variable.
- For this variable, leave the decimals at 2.
- Click on the box under “Label” and type I recommend course in the Label This longer label will show in appropriate windows and on your printouts. The labels can be up to 40 characters but it is best to keep them about 20 or less or your outputs may be difficult to read.
In the Values column of Fig. 2.5, do the following:
- Click on the word “None” and you will see a small blue box with three dots. □
- Click on the three dots. You will then see a screen like Fig. 2.6. We decided to add value labels for the lower and upper end of the Likert scale to help us interpret the data, but it is not as important to add labels for Likert or other ordered data as it is when the data are nominal or unordered.
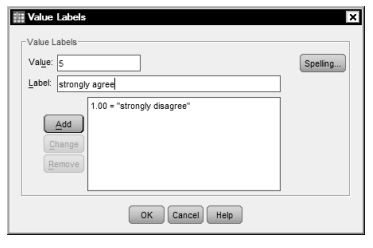
Fig. 2.6. Value labels window.
- Type 1 in the Value box in Fig. 2.6.
- Type strongly disagree in the Value Label Press Add.
- Type 5 and strongly agree in the Values and Value Labels Your window should look like Fig. 2.6 just before you click on Add for the second time.
- Click on
- Then click OK.
- Leave the cells for the Missing to Measure columns in Fig. 2.5 as they currently appear.
- Change Role to Both because recommend could be used as either an Input (independent) or a Target (dependent) variable. See Figure 2.7. Different researchers might code these variables differently. For example, if they planned to use recommend only as an independent variable in their study, they would code Role as Input.
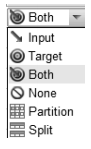
Fig. 2.7. Role selection.
Now let’s define and label the next variable.
- Click on the next blank box under Name (in Row 2) to enter the name of the next variable. Note spaces are not allowed in variable names. Spaces are allowed in labels.
- Type workhard in the Name column and press Enter.
- Click on the box in Row 2 under Label and type I worked hard in the Label column.
- Insert the highest and lowest Values for this variable the same way you did for recommend (1 = strongly disagree and 5 = strongly agree).
Keep all the other columns as they are.
Define and Label College and Gender
- Now, select the cell under Name and in Row 3.
- Call this third variable college by typing that in the box.
- Click on the third box under Decimals. For this variable, there is no reason to have any decimal places because people were asked to choose only one of the three colleges. You will notice that when you select the box under Decimals, up and down arrows appear on the right side of the box. You can either click the arrows to raise or lower the number of decimals, or you can double click on the box and manually type in the desired number.
- For the purposes of this variable, select or type 0 as the number of
- Next, click the box under Label to type in the variable label
- Under Values, click on None and then click on the small blue box with three dots.
- In the Value Labels window, type 1 in the Value box, type arts and sciences in the Value Label
- Then click Add. Do the same for 2 = business, 3 = engineering, 98 = other, multiple ans., 99 = blank.
The Value Labels window should resemble Fig. 2.8 just before you click Add for the last time.
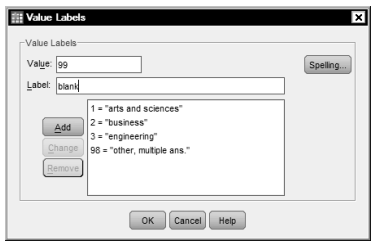
Fig. 2.7. Role selection.
- Then click OK.
- Under Measure, click the box that reads
- Click the down arrow and choose Nominal because for this variable the categories are unordered or nominal.
Your screen should look like Fig. 2.9 just after you click on nominal.
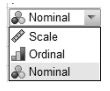
Fig. 2.9. Measurement selection.
- Change Role to Input because college will only be used as an independent variable.
- Under Missing, click on None and then on the three dots. Click on Discrete Missing Values and enter 98 and 99 in the first two boxes. (See Fig. 2.10.) This step is essential if you have one or more specific values that you want to use as missing value code(s). If you leave the Missing cell at None, the program will not know that 98 and 99 should be considered missing. None in this column is somewhat misleading. None means no special missing values (i.e., only blanks are considered missing).
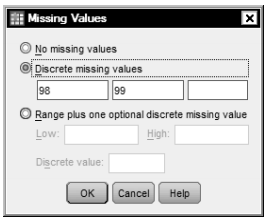
Fig. 2.10. Missing values.
Then click on OK.
Your Data Editor should now look like Fig. 2.11.

Fig. 2.11. Completed variable view for the first three variables.
Now define and label gender similarly to how you did this for college.
- First, type the variable Name gender in the next blank row in Fig. 2.11
- Click on Decimals to change the decimal places to 0 (zero).
- Now click on Labels and label the variable
- Next you must label the values or levels of the gender You need to be sure your coding matches your labels. We arbitrarily decided to code male as zero and female as 1.We could have coded female as zero and male as 1. There are some advantages to using 0 and 1 for the codes (“dummy coding”), as indicated below.
- Click on the Values
- Then, click on the blue three-dot box to get a window like Fig. 2.6 again. Remember, this is the same process you conducted when entering the labels for the values of the first three variables.
- Now, type 0 to the right of Value.
- To the right of Label type Click on Add.
- Repeat this process for 1 = Click on Add.
- Click
- Click on Scale under Measure to change the level of measurement to Nominal because this is an unordered, dichotomous variable.
- Finally, click on Input under Role because gender will be an independent variable.
Once again, realize that the researcher has made a series of decisions that another researcher could have done differently, as we noted earlier with the Role of the recommend variable. For example, you could have used 1 and 2 as the values for gender, and you might have given males the higher number. We have chosen, in this case, to do what is called dummy coding. In essence, 1 is female and 0 is not female. This type of coding is useful for interpreting gender when used in statistical analysis. Similarly, we could have decided to consider the level of measurement ordinal, since dummy coded dichotomous variables can be used in analyses that require ordered data, as we will discuss in later chapters.
Define and Label Grade Point Average
You should now have enough practice to define and label the gpa variable. After naming the variable gpa, do the following:
- For Decimals leave the decimals at 2.
- Now click on Label and label it grade point average.
- Click on Type 0 = All Fs and 4 = All As. (Note that for this variable, we have used actual GPA to 2 decimals, rather than dividing it into ordered groups such as a C average, B average, A average.)
- Under Measure, leave it as Scale because this variable has many ordered values and is likely to be normally distributed.
- Under Role, click on
Define and Label the Last Three Variables
Now you should define the three variables related to the parts of the class that a student completed. Remember we said the Names of these variables would be: reading, homework, and extracrd. The variable Labels will be I did the reading, I did the homework, I did extra credit. The Value labels are: 0 = not checked/blank and 1 = checked. These variables should have no decimals, and the Measure should be changed to Nominal. Role should be changed to Target because these will be used as dependent variables. Your complete Variable View should look like Fig. 2.12.

Fig. 2.12. Completed variable view.
[1] It is no longer necessary to keep variable names at eight characters or less, but short names are desirable. Other rules about variable names still apply (see footnote 5 in Chapter 1). Note also that in this book we use bullets to indicate instructions about SPSS actions (e.g., click, highlight), and we use bold for key terms displayed in SPSS windows (e.g., Name).
Source: Morgan George A, Leech Nancy L., Gloeckner Gene W., Barrett Karen C.
(2012), IBM SPSS for Introductory Statistics: Use and Interpretation, Routledge; 5th edition; download Datasets and Materials.
15 Sep 2022
17 Sep 2022
31 Mar 2023
27 Mar 2023
15 Sep 2022
30 Mar 2023