In this chapter we showed how sample statistics such as a sample mean X, a sample standard deviation 5, and a sample proportion p can be used as point estimators of their corresponding population parameters m, s, and p. It is intuitively appealing that each of these sample statistics is the point estimator of its corresponding population parameter. However, before using a sample statistic as a point estimator, statisticians check to see whether the sample statistic demonstrates certain properties associated with good point estimators. In this section we discuss three properties of good point estimators: unbiased, efficiency, and consistency.
Because several different sample statistics can be used as point estimators of different population parameters, we use the following general notation in this section.

The notation U is the Greek letter theta, and the notation U is pronounced “theta-hat.” In general, U represents any population parameter such as a population mean, population standard deviation, population proportion, and so on; U represents the corresponding sample statistic such as the sample mean, sample standard deviation, and sample proportion.
1. Unbiased
If the expected value of the sample statistic is equal to the population parameter being estimated, the sample statistic is said to be an unbiased estimator of the population parameter.

Hence, the expected value, or mean, of all possible values of an unbiased sample statistic is equal to the population parameter being estimated.
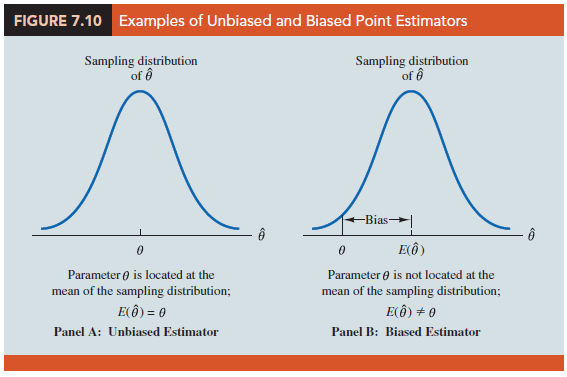
Figure 7.10 shows the cases of unbiased and biased point estimators. In the illustration showing the unbiased estimator, the mean of the sampling distribution is equal to the value of the population parameter. The estimation errors balance out in this case, because sometimes the value of the point estimator U may be less than U and other times it may be greater than U. In the case of a biased estimator, the mean of the sampling distribution is less than or greater than the value of the population parameter. In the illustration in Panel B of Figure 7.10, E(U) is greater than U; thus, the sample statistic has a high probability of overestimating the value of the population parameter. The amount of the bias is shown in the figure.
In discussing the sampling distributions of the sample mean and the sample proportion, we stated that E(x) = m and E(p) = p. Thus, both x and p are unbiased estimators of their corresponding population parameters m and p.
In the case of the sample standard deviation 5 and the sample variance s2, it can be shown that E(s2) = s2. Thus, we conclude that the sample variance s2 is an unbiased estimator of the population variance s2. In fact, when we first presented the formulas for the sample variance and the sample standard deviation in Chapter 3, n – 1 rather than n was used in the denominator. The reason for using n – 1 rather than n is to make the sample variance an unbiased estimator of the population variance.
2. Efficiency
Assume that a simple random sample of n elements can be used to provide two unbiased point estimators of the same population parameter. In this situation, we would prefer to use the point estimator with the smaller standard error, because it tends to provide estimates closer to the population parameter. The point estimator with the smaller standard error is said to have greater relative efficiency than the other.
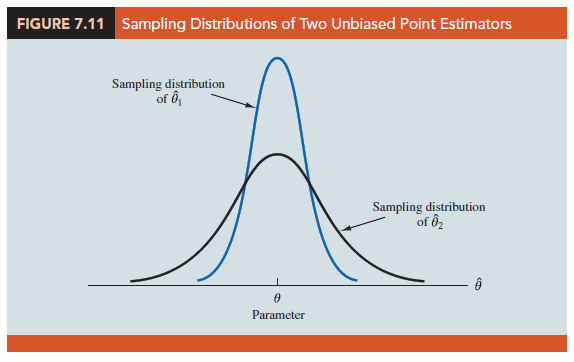
Figure 7.11 shows the sampling distributions of two unbiased point estimators, 91 and U2. Note that the standard error of U1 is less than the standard error of U2; thus, values of U1 have a greater chance of being close to the parameter U than do values of U2. Because the standard error of point estimator U1 is less than the standard error of point estimator U2, U1 is relatively more efficient than U2 and is the preferred point estimator.
3. Consistency
A third property associated with good point estimators is consistency. Loosely speaking, a point estimator is consistent if the values of the point estimator tend to become closer to the population parameter as the sample size becomes larger. In other words, a large sample size tends to provide a better point estimate than a small sample size. Note that for the sample mean X, we showed that the standard error of X is given by sx = s/Vn. Because sx is related to the sample size such that larger sample sizes provide smaller values for sx, we conclude that a larger sample size tends to provide point estimates closer to the population mean m. In this sense, we can say that the sample mean X is a consistent estimator of the population mean m. Using a similar rationale, we can also conclude that the sample proportion p is a consistent estimator of the population proportion p.
Source: Anderson David R., Sweeney Dennis J., Williams Thomas A. (2019), Statistics for Business & Economics, Cengage Learning; 14th edition.
30 Aug 2021
31 Aug 2021
28 Aug 2021
30 Aug 2021
30 Aug 2021
30 Aug 2021