Skip to content
    • info@phantran.net
  • Connecting and sharing with us
  • -
  • About us
    • info@phantran.net
HKT ConsultantHKT Consultant
  • Home
  • Corporate Management
    • Entrepreneurship
      • Startup
      • Entrepreneurship
      • Growth of firm
    • Managing primary activities
      • Marketing
      • Sales Management
      • Retail Management
      • Import – Export
      • International Business
      • E-commerce
      • Project Management
      • Production Management
      • Quality Management
      • Logistics Management
      • Supply Chain Management
    • Managing support activities
      • Strategy
      • Human Resource Management
      • Organizational Culture
      • Information System Management
      • Corporate Finance
      • Stock Market
      • Accounting
      • Office Management
  • Economics of Firm
    • Theory of the Firm
    • Management Science
    • Microeconomics
  • Research Methodology
    • Methodology
      • Research Process
      • Experimental Research
      • Research Philosophy
      • Management Research
      • Writing a thesis
      • Writing a paper
    • Qualitative Research
      • Literature Review
      • Interview
      • Case Study
      • Action Research
      • Qualitative Content Analysis
      • Observation
      • Phenomenology
    • Quantitative Research
      • Statistics and Econometrics
      • Questionnaire Survey
      • Quantitative Content Analysis
      • Meta Analysis
      • Statistical Software
        • STATA
        • SPSS
        • SEM-AMOS
        • SmartPLS
        • Eviews
Data File Management and Descriptive Statistics with SPSS – Problem 5.1: Count Math Courses Taken

Sometimes you want to know how many items the participants have taken, bought, done, agreed with, and so forth. One time this happens is when the subject is asked to “check all that apply.” In Chapter 2, we could have counted how many aspects of the class assignments (reading, homework, and extra credit) the

15
Sep
Data File Management and Descriptive Statistics with SPSS – Problem 5.2: Recode and Relabel Mother’s and Father’s Education

Now we will Recode mother’s education and father’s education so that those with no postsecondary education (2s and 3s) have a value of 1, those with some postsecondary will have 2, and those with a bachelor’s degree or more will have a value of 3. It is usually not desirable to dichotomize (divide into

15
Sep
Data File Management and Descriptive Statistics with SPSS – Problem 5.3: Recode and Compute Pleasure Scale Score

Now let’s Compute the average “pleasure from math” scale score (pleasure scale) from item02, item06 , item10, and item14 after reversing (Recoding) item06 and item10, which are negatively worded or low pleasure items (see the codebook in Chapter 1). We will keep both the new item06r and item10r and old (item06 and item10) variables

15
Sep
Data File Management and Descriptive Statistics with SPSS – Problem 5.4: Compute Parents’ Revised Education With the Mean Function

We have decided to combine father’s and mother’s education scores because, as we will find out later, they are highly correlated. Thus, for some purposes, it is better to treat them as one variable. We also want to demonstrate the use of the Mean function, which is a type of Compute function that we

1 Comments

15
Sep
Data File Management and Descriptive Statistics with SPSS – Problem 5.5: Check for Errors and Normality for the New Variables

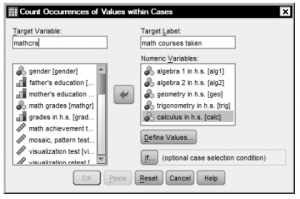
Run Descriptives in order to understand the new variables, check for errors, and see if they are distributed normally. Using Chapter 4 (Problem 4.1) as a guide, compute the descriptive statistics (Minimum, Maximum, Mean, Standard Deviation, Variance, and Skewness) for the new variables math courses taken, father’s educ revised, mother’s educ revised, pleasure scale,

1 Comments

15
Sep
Data File Management and Descriptive Statistics with SPSS: Describing the Sample Demographics and Key Variables

Using the information that you computed in Chapters 4 and 5, we can now describe this sample of the High School and Beyond (hsb) data. In an article or research report such as a thesis, you will, at a minimum, state the number of participants and provide summary information about the age, gender, and

15
Sep
Data File Management and Descriptive Statistics with SPSS: Saving the Updated HSB Data File

You should always save your data file if you entered new data or made any changes. If you forget to Save, you will have to do these Recodes and so forth over again! To save, follow these steps: Click on the Data Editor button at the bottom of your screen. Then click File ^

1 Comments

15
Sep
Inferential Statistics in SPSS: General Design Classifications for Difference Questions

Many research questions focus on whether there is a significant difference between two or more groups or conditions. When a group comparison or difference question is asked, the independent variable and design can be classified as between groups or within subjects. Understanding this distinction is one essential aspect of determining the proper statistical analysis

15
Sep
Inferential Statistics in SPSS: Selection of Inferential Statistics

How do you decide which of the many possible inferential statistics to use? Although this section may seem overwhelming at first because many statistical tests are introduced, don’t be concerned if you don’t now know much about the tests mentioned. You should come back to this chapter later, from time to time, when you

15
Sep
Inferential Statistics in SPSS: The General Linear Model

Whether or not there is a relationship between variables can be answered in two ways. For example, if each of two variables provides approximately normally distributed data with five or more levels, based on Fig. 6.1 and Table 6.2, the statistic to use is either the Pearson correlation or bivariate (simple) regression, and that

15
Sep
Inferential Statistics in SPSS: Interpreting the Results of a Statistical Test

In the following chapters, we present information about how to check assumptions, do the commands, interpret the previous statistics, and write about them. For each statistic, the program produces a number or calculated value based on the specific data in your study. They are labeled t, F, and so on, or sometimes just value.

15
Sep
Inferential Statistics in SPSS: An Example of How to Select and Interpret Inferential Statistics

As a review of what you read in Chapter 1 and this chapter, we now provide an extended example based on the HSB data. We will walk you through the process of identifying the variables, research questions, and approach, and then show how we selected appropriate statistics and interpreted the results. Research problem. Suppose

15
Sep
Inferential Statistics in SPSS: Writing About Your Outputs

One of the goals of this book is to help you write a research report or thesis using the outputs. Thus, we have provided an example later that could be two paragraphs from a research paper based on the expanded HSB data used in the assignments in this book. Before demonstrating how you might

1 Comments

15
Sep
Problem 7.1: Chi-Square and Phi (or Cramer’s V) with SPSS

The statistics discussed in this first problem are designed to analyze two nominal or dichotomous variables. Remember, nominal variables are variables that have distinct unordered levels or categories; each subject is in only one level (you can only be male or female). Chi-square (x2) or phi/Cramer’s V are good choices for statistics when analyzing

16
Sep
Problem 7.2: Risk Ratios and Odds Ratios with SPSS

When you have two dichotomous variables and thus a 2 x 2 contingency table or cross-tabulation, you can compute risk ratios and odds ratios instead of chi-square and phi. These ratios are commonly used to report results in medical, applied health, and prevention science fields. The assumptions for odds ratios are listed under Problem

16
Sep
Problem 7.3: Other Nonparametric Associational Statistics with SPSS

In addition to phi and Cramer’s V, there are several other nonparametric measures of association that we could have chosen in Fig. 7.2. They attempt, in different ways, to measure the strength of the association between two variables. If both variables are nominal and you have a 2 x 2 cross­tabulation, like the one

16
Sep
Problem 7.4: Cross-Tabulation and Eta with SPSS

There is an important associational statistic, eta, that is used when one variable is nominal and the other is approximately normal or scale. We will use this statistic to describe the association between gender and math courses taken (an approximately normal variable with six levels). Eta squared will be an important statistic in later

16
Sep
Problem 7.5: Cohen’s Kappa for Reliability With Nominal Data with SPSS

When we have two nominal variables with the same values (usually two raters’ observations or scores using the same codes), you can compute Cohen’s kappa to check the reliability or agreement between the measures. Kappa has a few assumptions about the underlying nature of the data: 1) Participants are independent of each other, 2)

1 Comments

16
Sep
Correlation and Regression with SPSS – Problem 8.1: Scatterplots to Check Assumptions

A scatterplot is a plot or graph of two variables that shows how the score for an individual on one variable associates with his or her score on the other variable. If the correlation is high positive, the plotted points will be close to a straight line (the linear regression line) from the lower

16
Sep
Correlation and Regression with SPSS – Problem 8.2: Bivariate Pearson and Spearman Correlations

The Pearson product moment correlation is a bivariate parametric statistic used when both variables are approximately normally distributed (i.e., scale data). When you have ordinal data or when assumptions are markedly violated, one should use a nonparametric equivalent of the Pearson correlation coefficient. One such nonparametric, ordinal statistic is the Spearman rho (another is

16
Sep
  • 1
  • …
  • 177
  • 178
  • 179
  • 180
  • 181
  • 182
  • 183
  • …
  • 196
Theories of the firm
  • Great Thinkers and their Big IdeasGreat Thinkers and their Big Ideas
  • Theory of Competitive AdvantageTheory of Competitive Advantage
  • Theory of Organizational structureTheory of Organizational structure
  • What is a Scientific Theory?What is a Scientific Theory?
  • Organizational Ecology TheoryOrganizational Ecology Theory
  • List of Theological Belief SystemsList of Theological Belief Systems
  • Property Rights TheoryProperty Rights Theory
  • Agency TheoryAgency Theory

Most Read in 30 days

Methodology & Skills
  • Create your professional WordPress website without codeCreate your professional WordPress website without code
  • Doing Management Research: A Comprehensive GuideDoing Management Research: A Comprehensive Guide
  • Quantitative Research: Definition, Methods, Types and ExamplesQuantitative Research: Definition, Methods, Types and Examples
  • Qualitative methods: what and why use them?Qualitative methods: what and why use them?
  • Learn Programming Languages (JavaScript, Python, Java, PHP, C, C#, C++, HTML, CSS)Learn Programming Languages (JavaScript, Python, Java, PHP, C, C#, C++, HTML, CSS)
  • A Comparison of R, Python, SAS, SPSS and STATA for a Best Statistical SoftwareA Comparison of R, Python, SAS, SPSS and STATA for a Best Statistical Software
  • Research methodology: a step-by-step guide for beginnersResearch methodology: a step-by-step guide for beginners

Connecting and sharing with us

... by your free and real actions.

hotlineTComment and discuss your ideas

Enthusiastic to comment and discuss the articles, videos on our website by sharing your knowledge and experiences.

hỗ trợ hkt Respect the copyright

Updating and sharing our articles and videos with sources from our channel.

hỗ trợ hkt Subscribe and like our articles and videos

Supporting us mentally and with your free and real actions on our channel.

HKT Channel - Science Theories

About HKT CHANNEL
About HKT CONSULTANT

Website Structure

Corporate Management
Startup & Entrepreneurship
Management Science
Theories of the firm

HKT Consultant JSC.

      "Knowledge - Experience - Success"
- Email: Info@phantran.net
- Website:
phantran.net

  • Home
  • Corporate Management
    • Entrepreneurship
      • Startup
      • Entrepreneurship
      • Growth of firm
    • Managing primary activities
      • Marketing
      • Sales Management
      • Retail Management
      • Import – Export
      • International Business
      • E-commerce
      • Project Management
      • Production Management
      • Quality Management
      • Logistics Management
      • Supply Chain Management
    • Managing support activities
      • Strategy
      • Human Resource Management
      • Organizational Culture
      • Information System Management
      • Corporate Finance
      • Stock Market
      • Accounting
      • Office Management
  • Economics of Firm
    • Theory of the Firm
    • Management Science
    • Microeconomics
  • Research Methodology
    • Methodology
      • Research Process
      • Experimental Research
      • Research Philosophy
      • Management Research
      • Writing a thesis
      • Writing a paper
    • Qualitative Research
      • Literature Review
      • Interview
      • Case Study
      • Action Research
      • Qualitative Content Analysis
      • Observation
      • Phenomenology
    • Quantitative Research
      • Statistics and Econometrics
      • Questionnaire Survey
      • Quantitative Content Analysis
      • Meta Analysis
      • Statistical Software
        • STATA
        • SPSS
        • SEM-AMOS
        • SmartPLS
        • Eviews
  • About us