There is an important associational statistic, eta, that is used when one variable is nominal and the other is approximately normal or scale. We will use this statistic to describe the association between gender and math courses taken (an approximately normal variable with six levels). Eta squared will be an important statistic in later chapters when we interpret the effect size of various ANOVAs.
- What is the association between gender and number of math courses taken? How strong is it?
Follow these steps:
- Click on Analyze → Descriptive Statistics → Crosstabs...
- Click on Reset to clear the previous entries.
- Put math courses taken in the Rows box using the arrow key and put gender in the Columns box (similar to Fig. 7.1).
- Next, click on Statistics and select Eta.
- Click on Continue.
- Now, click on Cells and select Expected and
- Click on Continue.
- Click on OK. Compare your syntax and output to Output 7.4.
Output for Problem 7.4: Eta for Gender and Math Courses Taken
CROSSTABS
/TABLES=mathcrs BY gender
/FORMAT= AVALUE TABLES
/STATISTICS=ETA
/CELLS= COUNT EXPECTED
/COUNT ROUND CELL.
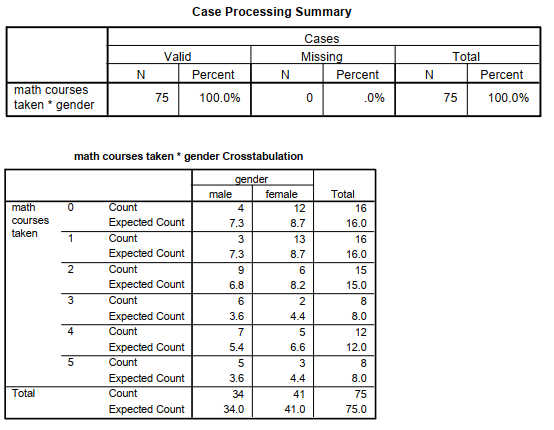
Crosstabs
Interpretation of Output 7.4
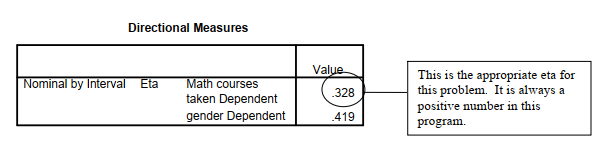
The second table shows the actual Counts and the Expected Counts of the number of persons in each cell. If there are positive discrepancies between the actual and expected counts in the upper left (male) columns and negative discrepancies in the lower left columns or vice versa, that would indicate that there is an association between the two variables. Because of the way the program computes eta, it ranges from zero to about +1.0. High values of eta indicate a strong association. In this case, the appropriate eta is .328 because math courses taken is the dependent variable. It is a medium to large effect size (see Table 6.5). With 75 subjects, an eta of .33 probably would be statistically significant, but this program does not test it. Eta squared would be .11, indicating that the two variables share 11% common variance. We will see eta squared when interpreting the size of the “effect” in analysis of variance.
Example of How to Write About Problem 7.4
Results
Eta was used to investigate the strength of the association between gender and number of math courses taken (eta = .33). This is a medium to large effect size (Cohen, 1988). Males were more likely to take several or all the math courses than females.
Source: Morgan George A, Leech Nancy L., Gloeckner Gene W., Barrett Karen C.
(2012), IBM SPSS for Introductory Statistics: Use and Interpretation, Routledge; 5th edition; download Datasets and Materials.
27 Mar 2023
20 Sep 2022
20 Sep 2022
22 Sep 2022
31 Mar 2023
16 Sep 2022