Skip to content
    • info@phantran.net
  • Connecting and sharing with us
  • -
  • About us
    • info@phantran.net
HKT ConsultantHKT Consultant
  • Home
  • Corporate Management
    • Entrepreneurship
      • Startup
      • Entrepreneurship
      • Growth of firm
    • Managing primary activities
      • Marketing
      • Sales Management
      • Retail Management
      • Import – Export
      • International Business
      • E-commerce
      • Project Management
      • Production Management
      • Quality Management
      • Logistics Management
      • Supply Chain Management
    • Managing support activities
      • Strategy
      • Human Resource Management
      • Organizational Culture
      • Information System Management
      • Corporate Finance
      • Stock Market
      • Accounting
      • Office Management
  • Economics of Firm
    • Theory of the Firm
    • Management Science
    • Microeconomics
  • Research Methodology
    • Methodology
      • Research Process
      • Experimental Research
      • Research Philosophy
      • Management Research
      • Writing a thesis
      • Writing a paper
    • Qualitative Research
      • Literature Review
      • Interview
      • Case Study
      • Action Research
      • Qualitative Content Analysis
      • Observation
      • Phenomenology
    • Quantitative Research
      • Statistics and Econometrics
      • Questionnaire Survey
      • Quantitative Content Analysis
      • Meta Analysis
      • Statistical Software
        • STATA
        • SPSS
        • SEM-AMOS
        • SmartPLS
        • Eviews
Problem 8.2: Hierarchical Logistic Regression with SPSS

We will rerun Problem 8.1, but this time we will enter the background variables gender and parents’ education first and then, on the second step or block, enter mosaic and visualization test. If we control for gender and parents’ education, will mosaic and/or visualization test add to the prediction of whether students will take

19
Sep
Problem 8.3: Discriminant Analysis with SPSS

Discriminant analysis is appropriate when you want to predict which group participants will be in (in this example, who took algebra 2). The procedure produces a discriminant function (or for more than two groups, a set of discriminant functions) based on linear combinations of the predictor variables that provide the best overall discrimination among

19
Sep
Problem 9.1: Factorial (Two-Way) ANOVA with SPSS

We would use a t test or one-way ANOVA to examine differences between two or more groups (comprising the levels of one independent variable or factor) on a continuous dependent variable. These designs, in which there is only one independent variable and it is a discrete or categorical variable, are called single­factor designs. In

19
Sep
Problem 9.2: Post Hoc Analyses of a Significant Interaction with SPSS

We have described, in the interpretation of Output 9.1, how to visually inspect and interpret the Profile Plots when there is a statistically significant interaction. In Problems 9.2b and 9.2c we will illustrate two ways to test the simple effects statistically. In the interpretation of Output 9.1, we indicated that you should examine the

19
Sep
Problem 9.3: Analyses of Covariance (ANCOVA) with SPSS

ANCOVA is an extension of ANOVA that typically provides a way of statistically controlling for the effects of continuous or scale variables that you are concerned about but that are not the focal point or independent variable(s) in the study. These continuous variables are called covariates (or sometimes, control variables). Covariates usually are variables

19
Sep
Repeated-Measures and Mixed ANOVAs with SPSS: The Product Data Set

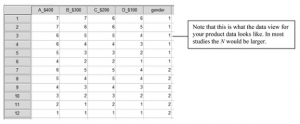
Open the SPSS for Windows program. Open the Product data set. Do not retrieve the hsbdataNew for this assignment. In this study, each of the 12 participants (or subjects) has evaluated four products that vary in cost (e.g., four brands of DVD players) on 1-7 Likert scales. Product A is the most expensive (i.e.,

19
Sep
Problem 10.1: Repeated-Measures ANOVA with SPSS

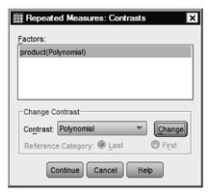
The GLM repeated-measures procedure provides a variety of analysis of variance procedures to use when the same measurement is made several times on each subject or the same measurement is made on several related subjects. The single­factor repeated-measures ANOVA, which we will use for Problem 10.1, is appropriate when you have one independent variable

1 Comment

19
Sep
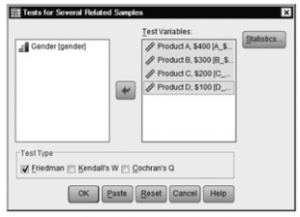
Problem 10.2: The Friedman Nonparametric Test for Several Related Samples with SPSS

What could you do if the product ratings are ordinal data or the repeated- measures ANOVA assumptions are markedly violated? One answer is to use a nonparametric statistic. As you can tell from Table 5.1, an appropriate nonparametric test for when you have more than two levels of one repeated- measures or related samples

19
Sep
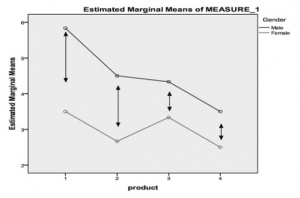
Problem 10.3: Mixed ANOVA with SPSS

You can test null hypotheses about the effects of both between-groups factors and within-subjects factors with a Mixed ANOVA using the General Linear Model procedure. You can investigate interactions between factors as well as the effects of individual factors on a dependent variable. Repeat Problem 10.1 except add gender to see if there are

19
Sep
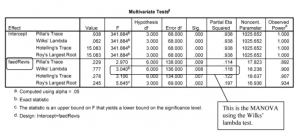
Problem 11.1: GLM Single-Factor Multivariate Analysis of Variance with SPSS

Sometimes you have more than one dependent variable that you want to analyze simultaneously. The GLM multivariate procedure allows you to analyze differences between levels of one or more (usually nominal level) independent variables, with respect to a linear combination of several dependent variables. One can also include normally distributed variables (covariates) as predictors

20
Sep
Problem 11.2: GLM Two-Factor Multivariate Analysis of Variance with SPSS

MANOVA is also useful when there is more than one independent variable and several related dependent variables. Let’s answer the following questions: Do students who differ in math grades and gender differ on a linear combination of two dependent variables (math achievement and visualization test)? Do males and females differ in terms of whether

20
Sep
Problem 11.3: Mixed MANOVA with SPSS

There might be times when you want to find out if there are differences between groups as well as within subjects; this can be answered with Mixed MANOVA. We have created a new dataset to use for this problem (MixedMANOVAdata). Retrieve MixedMANOVAdata.sav. Let’s answer the following question: Is there a difference between participants in

20
Sep
Problem 12.1: Unconditional Level 1 Repeated-Measures Model with SPSS

Although one can use GLM to compute analyses of repeated-measures data, as shown in Chapter 10, multilevel models often are more useful for analyzing repeated-measures data for several reasons. First, it is possible to use multilevel models even if there is some incomplete information on some participants or if their data are from different

20
Sep
Problem 12.2: Repeated Measures with Level 2 Predictor with SPSS

Now that we have determined that there is significant variance to explain, we will test another model with a Level 2 predictor, gender. This analysis will enable us to answer the following question: Does knowing a person’s gender help us in understanding his or her growth from age 8 to age 14, as measured

20
Sep
Problem 12.3: Unconditional Individuals-Nested-in-Schools Model with SPSS

For this problem, you will need to retrieve a new data set, HSB12.sav (not HSBdataNew.sav or any of the other datasets). This data set was downloaded from http://www.ats.ucla.edu/stat/paperexamples/singer/ with permission of Professor Judith D. Singer, and it was also analyzed in Raudenbush & Bryk (2002) and Singer (1998). It involves much of the same

1 Comment

20
Sep
Problem 12.4: Conditional Individuals-Nested-in-Schools Model with Level 1 Covariate with SPSS

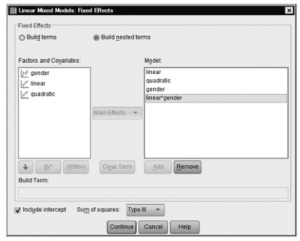
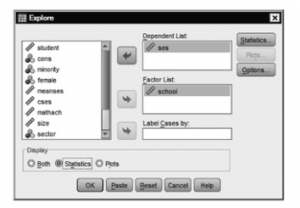
In Problem 12.4, we could have looked at meanses, which is a variable at the school level (Level 2) and is the average socioeconomic class for the students in a particular school. As part of this problem, we will show you how you might have calculated meanses if it were not already available. However,

1 Comment

20
Sep
Randomness of Missing Data with SPSS

Are data missing completely at random (MCAR)? If data are MCAR, then whether or not a value is missing (missingness) is not related systematically to the values of that variable or any other variables (see Little & Rubin, 2002). If such a condition holds, then the only problem created by missing data is reduction

20
Sep
Problem 13.1: Patterns of the Missing Data with SPSS

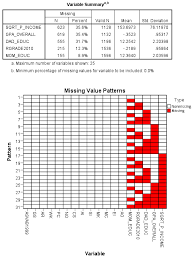
In this problem, we will examine the missing data to see if they appear to be MAR and to see if multiple imputation seems advisable. 13.1. What are the patterns of missing values of weight, binge, mood, and preo? Is multiple imputation advisable for any of these variables? If so, which ones? Click on

1 Comment

20
Sep
Problem 13.2: Restructuring and Imputing the Data with SPSS

Next, we will conduct the actual imputations, but first, we need to restructure the dataset so that we can use the information about time to predict missingness (given what we found before about patterns 15 and 16 in which some participants stopped participating after time 2 or 3. Click on Date→Restructure. In the Restructure

1 Comment

20
Sep
Problem 13.3: Mixed Models Analysis after Imputed Data with SPSS

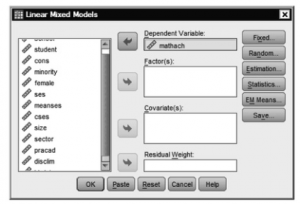
We will now conduct a mixed model analysis on the imputed data. This analysis is appropriate because our data involve repeated measures that are arrayed as multiple lines for each participant. The Mixed Models procedure is one that is set up in SPSS to readily read and use imputation datasets. We have discussed this

20
Sep
  • 1
  • …
  • 180
  • 181
  • 182
  • 183
  • 184
  • 185
  • 186
  • …
  • 196
Theories of the firm
  • Systems TheorySystems Theory
  • Economic Theories and ConceptsEconomic Theories and Concepts
  • Resource-based theoryResource-based theory
  • Evolutionary Theory of the FirmEvolutionary Theory of the Firm
  • Theory of Organizational PowerTheory of Organizational Power
  • Decision TheoryDecision Theory
  • Transaction Cost EconomicsTransaction Cost Economics
  • Organizational Ecology TheoryOrganizational Ecology Theory

Methodology & Skills
  • Learn Programming Languages (JavaScript, Python, Java, PHP, C, C#, C++, HTML, CSS)Learn Programming Languages (JavaScript, Python, Java, PHP, C, C#, C++, HTML, CSS)
  • Doing Management Research: A Comprehensive GuideDoing Management Research: A Comprehensive Guide
  • Qualitative methods: what and why use them?Qualitative methods: what and why use them?
  • Research methodology: a step-by-step guide for beginnersResearch methodology: a step-by-step guide for beginners
  • A Comparison of R, Python, SAS, SPSS and STATA for a Best Statistical SoftwareA Comparison of R, Python, SAS, SPSS and STATA for a Best Statistical Software
  • Quantitative Research: Definition, Methods, Types and ExamplesQuantitative Research: Definition, Methods, Types and Examples
  • Create your professional WordPress website without codeCreate your professional WordPress website without code

Connecting and sharing with us

... by your free and real actions.

hotlineTComment and discuss your ideas

Enthusiastic to comment and discuss the articles, videos on our website by sharing your knowledge and experiences.

hỗ trợ hkt Respect the copyright

Updating and sharing our articles and videos with sources from our channel.

hỗ trợ hkt Subscribe and like our articles and videos

Supporting us mentally and with your free and real actions on our channel.

HKT Channel - Science Theories

About HKT CHANNEL
About HKT CONSULTANT

Website Structure

Corporate Management
Startup & Entrepreneurship
Management Science
Theories of the firm

HKT Consultant JSC.

      "Knowledge - Experience - Success"
- Email: Info@phantran.net
- Website:
phantran.net

  • Home
  • Corporate Management
    • Entrepreneurship
      • Startup
      • Entrepreneurship
      • Growth of firm
    • Managing primary activities
      • Marketing
      • Sales Management
      • Retail Management
      • Import – Export
      • International Business
      • E-commerce
      • Project Management
      • Production Management
      • Quality Management
      • Logistics Management
      • Supply Chain Management
    • Managing support activities
      • Strategy
      • Human Resource Management
      • Organizational Culture
      • Information System Management
      • Corporate Finance
      • Stock Market
      • Accounting
      • Office Management
  • Economics of Firm
    • Theory of the Firm
    • Management Science
    • Microeconomics
  • Research Methodology
    • Methodology
      • Research Process
      • Experimental Research
      • Research Philosophy
      • Management Research
      • Writing a thesis
      • Writing a paper
    • Qualitative Research
      • Literature Review
      • Interview
      • Case Study
      • Action Research
      • Qualitative Content Analysis
      • Observation
      • Phenomenology
    • Quantitative Research
      • Statistics and Econometrics
      • Questionnaire Survey
      • Quantitative Content Analysis
      • Meta Analysis
      • Statistical Software
        • STATA
        • SPSS
        • SEM-AMOS
        • SmartPLS
        • Eviews
  • About us