The expected value, or mean, of a random variable is a measure of the central location for the random variable. The formula for the expected value of a discrete random variable x follows.
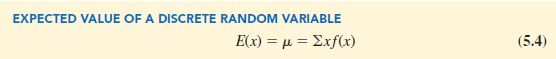
Both the notations E(x) and m are used to denote the expected value of a random variable.
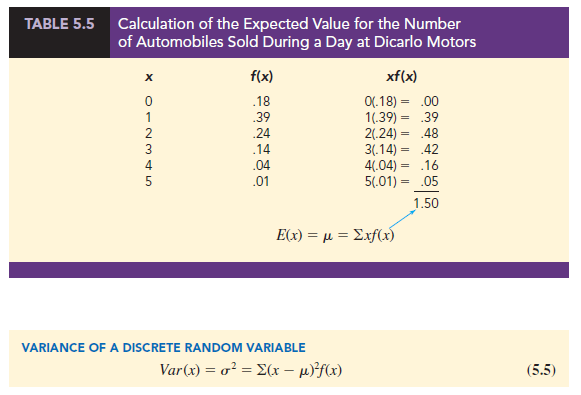
Equation (5.4) shows that to compute the expected value of a discrete random variable, we must multiply each value of the random variable by the corresponding probability f(x) and then add the resulting products. Using the DiCarlo Motors automobile sales example from Section 5.2, we show the calculation of the expected value for the number of automobiles sold during a day in Table 5.5. The sum of the entries in the xf (x) column shows that the expected value is 1.50 automobiles per day. We therefore know that although sales of 0, 1, 2, 3, 4, or 5 automobiles are possible on any one day, over time DiCarlo can anticipate selling an average of 1.50 automobiles per day. Assuming 30 days of operation during a month, we can use the expected value of 1.50 to forecast average monthly sales of 30(1.50) = 45 automobiles.
1. Variance
The expected value provides a measure of central tendency for a random variable, but we often also want a measure of variability, or dispersion. Just as we used the variance in Chapter 3 to summarize the variability in data, we now use variance to summarize the variability in the values of a random variable. The formula for the variance of a discrete random variable follows.
Copyright 2020 Cengage Learning. All Rights Reserved. May not be copied, scanned, or duplicated, in whole or in part. WCN 02-200-203
As equation (5.5) shows, an essential part of the variance formula is the deviation, x – m, which measures how far a particular value of the random variable is from the expected value, or mean, m. In computing the variance of a random variable, the deviations are squared and then weighted by the corresponding value of the probability function. The sum of these weighted squared deviations for all values of the random variable is referred to as the variance. The notations Var (x) and s2 are both used to denote the variance of a random variable.
The calculation of the variance for the probability distribution of the number of automobiles sold during a day at DiCarlo Motors is summarized in Table 5.6. We see that the variance is 1.25. The standard deviation, s, is defined as the positive square root of the variance. Thus, the standard deviation for the number of automobiles sold during a day is
![]()
The standard deviation is measured in the same units as the random variable (s = 1.118 automobiles) and therefore is often preferred in describing the variability of a random variable. The variance s2 is measured in squared units and is thus more difficult to interpret.

Source: Anderson David R., Sweeney Dennis J., Williams Thomas A. (2019), Statistics for Business & Economics, Cengage Learning; 14th edition.
28 Aug 2021
31 Aug 2021
30 Aug 2021
30 Aug 2021
31 Aug 2021
31 Aug 2021