Your task is to assess the financial standing of Home Depot, the home improvement company. Perhaps you are a mutual fund manager trying to decide whether to allocate $25 million of new money to Home Depot stock. You could be an investment banker seeking business from the company or a bondholder concerned with its credit standing. You could be the financial manager of Home Depot or of one of its competitors.
In each case, your first step is to assess the company’s current condition. You have before you the latest balance sheet and income statement.
1. The Balance Sheet
Table 28.1 sets out a simplified balance sheet for Home Depot for fiscal years 2017 and 2016. It provides a snapshot of the company’s assets at the end of the year and the sources of the money that was used to buy those assets.

The assets are listed in declining order of liquidity. For example, the accountant lists first those assets that are most likely to be turned into cash in the near future. They include cash itself, marketable securities and receivables (that is, bills to be paid by the firm’s customers), and inventories of raw materials, work in process, and finished goods. These assets are all known as current assets.
The remaining assets on the balance sheet consist of long-term, usually illiquid, assets such as warehouses, stores, fixtures, and vehicles. The balance sheet does not show up-to-date market values of these long-term assets. Instead, the accountant records the amount that each asset originally cost and deducts a fixed annual amount for depreciation of buildings, plant, and equipment. The balance sheet does not include all the company’s assets. Some of the most valuable ones are intangible, such as reputation, skilled management, and a well-trained labor force. Accountants are generally reluctant to record these assets in the balance sheet unless they can be readily identified and reasonably valued.[1]
Now look at the right-hand portion of Home Depot’s balance sheet, which shows where the money to buy the assets came from. The accountant starts by looking at the liabilities, that is, the money owed by the company. First come those liabilities that need to be paid off in the near future. These current liabilities include debts that are due to be repaid within the next year and payables (that is, amounts owed by the company to its suppliers).
The difference between the current assets and current liabilities is known as the net current assets or net working capital. It roughly measures the company’s potential reservoir of cash. For Home Depot in 2017,
Net working capital = current assets – current liabilities = 18,933 – 16,194 = $2,739
The bottom portion of the balance sheet shows the sources of the cash that was used to acquire the net working capital and fixed assets. Some of the cash has come from the issue of bonds and leases that will not be repaid for many years. After all these long-term liabilities have been paid off, the remaining assets belong to the common stockholders. The company’s equity is simply the total value of the net working capital and fixed assets less the long-term liabilities. Part of this equity has come from the sale of shares to investors, and the remainder has come from earnings that the company has retained and invested on behalf of the shareholders.
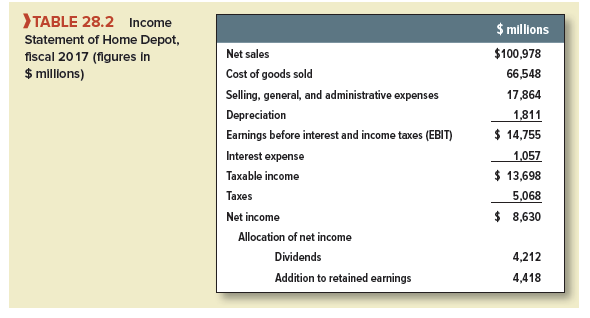
2. The Income Statement
If Home Depot’s balance sheet resembles a snapshot of the firm at a particular point in time, its income statement is like a video. It shows how profitable the firm has been over the past year.
Look at the summary income statement in Table 28.2. You can see that during 2017, Home Depot sold goods worth $100,978 million.2 The total cost of purchasing and selling these goods was $66,548 + $17,864 = $84,412 million. In addition to these out-of-pocket expenses, Home Depot also deducted depreciation of $1,811 million for the value of the fixed assets used up in producing the goods. Thus Home Depot’s earnings before interest and taxes (EBIT) were
EBIT = total revenues – costs – depreciation = 100,978 -84,412- 1,811 = $14, 755 million
Of this sum, $1,057 million went to pay the interest on the short- and long-term debt (remember debt interest is paid out of pretax income) and a further $5,068 million went to the government in the form of taxes. The $8,630 million that was left over belonged to the shareholders. Home Depot paid out $4,212 million as dividends and reinvested the remainder in the business.
I have been browsing online more than three hours today, yet I never found any interesting article like yours. It is pretty worth enough for me. Personally, if all web owners and bloggers made good content as you did, the net will be a lot more useful than ever before.