You want to use Home Depot’s financial statements to assess its financial performance and current standing. Where do you start?
At the close of fiscal 2017, Home Depot’s common stock was priced at $204.92 per share. There were 1,170 million shares outstanding, so total market capitalization was 1,170 X $204.92 = $239,756 million. This is a big number, of course, but Home Depot is a sizable company. Its shareholders have, over the years, invested billions in the company. Therefore, you decide to compare Home Depot’s market capitalization with the book value of its equity. The book value measures shareholders’ cumulative investment in the company.
At the end of fiscal 2017, the book value of Home Depot’s equity was $1,454 million. Therefore, the market value added, the difference between the market value of the firm’s shares and the amount of money that shareholders have invested in the firm, was $239,756 – $1,454 = $238,302 million.[1] In other words, Home Depot’s shareholders have contributed just over $1 billion and ended up with shares worth about $240 billion. They have accumulated nearly $239 billion in market value added.
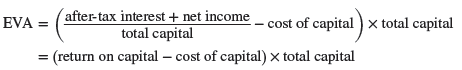
The consultancy firm, EVA Dimensions, calculates market value added for a large sample of U.S. companies. Table 28.3 shows a few of the firms from EVA Dimensions’ list. Apple is top of the class. It has created nearly $800 billion of wealth for its shareholders. Bank of America languishes near the bottom; the market value of its shares is $66 billion less than the amount that shareholders have invested in the firm.
These two firms are large. Their managers have lots of assets to work with. A small firm could not hope to create so much extra value as firms like Johnson & Johnson or Walmart or to lose as much as Bank of America. Therefore, financial managers and analysts also like to calculate how much value has been added for each dollar that shareholders have invested. To do this, they compute the ratio of market value to book value. For example, Home Depot’s market-to-book ratio is
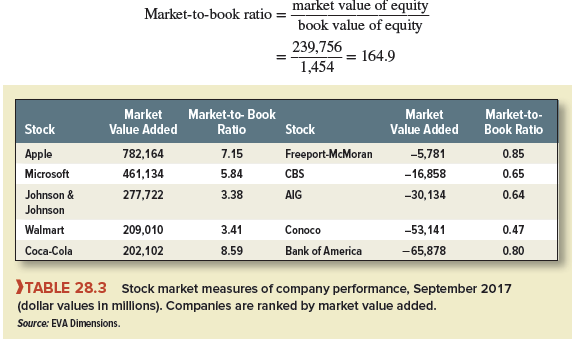
In other words, Home Depot has multiplied the value of its shareholders’ investment 164.9 times. This is a very large number, but Home Depot has been buying back its stock and, as a result, the book value of the equity has been reduced by the cost of the repurchases. A very active repurchase program can reduce the book equity to zero.5 This makes it very difficult to interpret ratios that include book equity in the denominator.
Table 28.3 also shows market-to-book ratios for our sample of U.S. companies. Notice that Coca-Cola has a much higher market-to-book ratio than Johnson & Johnson. But Johnson & Johnson’s market value added is higher because of its larger scale.
The market value performance measures in Table 28.3 have three drawbacks. First, the market value of the company’s shares reflects investors’ expectations about future performance. Investors pay attention to current profits and investment, of course, but market-value measures can, nevertheless, be noisy measures of current performance.
Second, measures of market performance are only a first step toward understanding the reasons for the performance. Are the measures an indication of the manager’s competence? Are they a reflection of events that are outside the manager’s control, or do they just suggest fluctuations in investor sentiment?
Third, you can’t look up the market value of privately owned companies whose shares are not traded. Nor can you observe the market value of divisions or plants that are parts of larger companies. You may use market values to satisfy yourself that Home Depot as a whole has performed well, but you can’t use them to drill down to look at the performance of, say, its overseas stores or particular U.S. stores. To do this, you need accounting measures of profitability. We start with economic value added (EVA).
1. Economic Value Added
When accountants draw up an income statement, they start with revenues and then deduct operating and other costs. But one important cost is not included: the cost of the capital that the company has raised from investors. Therefore, to see whether the firm has truly created value, we need to measure whether it has earned a profit after deducting all costs, including its cost of capital.
The cost of capital is the minimum acceptable rate of return on capital investment. It is an opportunity cost of capital, because it equals the expected rate of return on investment opportunities open to investors in financial markets. The firm creates value for investors only if it can earn more than its cost of capital, that is, more than its investors can earn by investing on their own.
The profit after deducting all costs, including the cost of capital, is called the company’s economic value added or EVA. We encountered EVA in Chapter 12, where we looked at how firms often link executive compensation to accounting measures of performance. Let’s calculate EVA for Home Depot.
Total long-term capital, sometimes called total capitalization, is the sum of long-term debt and shareholders’ equity. Home Depot entered fiscal 2017 with a total capitalization of $26,682 million, which was made up of $22,349 million of long-term debt and $4,333 million of shareholders’ equity. This was the cumulative amount that had been invested in the past by the debt- and equityholders. Home Depot’s weighted-average cost of capital was about 8.2%. Therefore, investors who provided the $26,682 million required the company to earn at least .082 x 26,682 = $2,188 million for its debt- and equityholders.
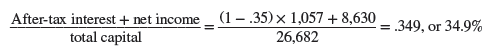
In 2017, Home Depot’s after-tax interest and net income totaled (1 – .35) x 1,057 + 8,630 = $9,317 million (the tax rate in 2017 was 35%). If you deduct the total cost of the company’s capital from this figure, you can see that it earned $9,317 – 2,188 = $7,129 million more than investors required. This was Home Depot’s residual income, or EVA:
EVA = (after-tax interest + net income) – (cost of capital X capital)
= 9,317 – 2,188 = $7,129 million
Sometimes it is helpful to re-express EVA as follows:
The return on capital or ROC is equal to the total profits that the company has earned for its debt- and equityholders, divided by the amount of money that they have contributed. If the company earns a higher return on its capital than investors require, EVA is positive.
In the case of Home Depot, with a 35% tax rate the return on capital was
Home Depot’s cost of capital was about 8.2%. So,
EVA = (return on capital – cost of capital) X total capital = (.349 – .082) X 26,682 = $7,129
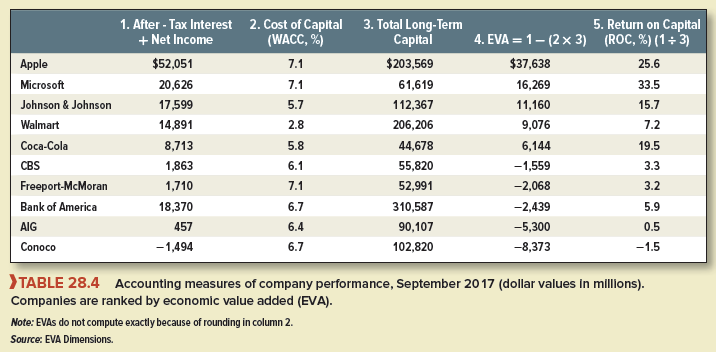
The first four columns of Table 28.4 show measures of EVA for our sample of large companies. Apple again heads the list. It earned $37.6 billion more than was needed to satisfy investors. By contrast, Bank of America was a laggard. Although it earned an accounting profit of $18.4 billion, this figure was calculated before deducting the cost of the capital that was employed. After deducting the cost of the capital, Bank of America made an EVA loss of $2.4 billion.
2. Accounting Rates of Return
EVA measures how many dollars a business is earning after deducting the cost of capital. Other things equal, the more assets the manager has to work with, the greater the opportunity to generate a large EVA. The manager of a small division may be highly competent, but if that division has few assets, she is unlikely to rank high in the EVA stakes. Therefore, when comparing managers, it can also be helpful to measure the firm’s return per dollar of investment.
Three common return measures are the return on capital (ROC), the return on equity (ROE), and the return on assets (ROA). All are based on accounting information and are therefore known as book rates of return.
Return on Capital6 We have already calculated Home Depot’s return on capital in 2017:
![]() ., ‘°
., ‘°
The company’s cost of capital (WACC) was about 8.2%. So we can say that the company earned nearly 27% more than shareholders demanded.
Notice that, when we calculated Home Depot’s return on capital, we summed the company’s after-tax interest and net income.[3] [4] The reason that we subtracted the tax shield on debt interest was that we wished to calculate the income that the company would have earned with all-equity financing. The tax advantages of debt financing are picked up when we compare the company’s return on capital with its weighted-average cost of capital (WACC).[5] WACC already includes an adjustment for the interest tax shield.[6] More often than not, financial analysts ignore this refinement and use the gross interest payment to calculate ROC. It is only approximately correct to compare this measure with the weighted- average cost of capital.
The last column in Table 28.4 shows the return on capital for our sample of well-known companies. Notice that Microsoft’s return on capital was 33.5%, more than 26 percentage points higher than its cost of capital. Although Microsoft had a higher return than Apple, it had a slightly lower EVA. This was because it had far fewer dollars invested than Apple.
Return on Equity We measure the return on equity (ROE) as the income to shareholders per dollar invested. Home Depot had net income of $8,630 million in 2017 and stockholders’ equity of $4,333 million at the start of the year. So its return on equity was
![]()
Has the company provided an adequate return for shareholders? To answer that question, we need to compare it with the company’s cost of equity. Home Depot’s cost of equity capital in 2017 was about 9.0%, so its return on equity was dramatically higher than its cost of equity, but remember once again our earlier warning about the effect of repurchases on the book value of Home Depot’s equity.
Return on Assets Return on assets (ROA) measures the income available to debt and equity investors per dollar of the firm’s total assets. Total assets (which equal total liabilities plus shareholders’ equity) are greater than total capital because total capital does not include current liabilities.[7] With a 35% tax rate the return on Home Depot’s assets was
![]()
When we subtract the tax shield on Home Depot’s interest payments, we are asking how much the company would have earned if all-equity-financed. This adjustment is helpful when comparing the profitability of firms with very different capital structures. Again, this refinement is ignored more often than not, and ROA is calculated using the gross interest payment. Sometimes analysts take no account of interest payments and measure ROA as the income for equityholders divided by total assets. This measure ignores entirely the income that the assets have generated for debtholders.
We will see shortly how Home Depot’s return on assets is determined by the sales that these assets generate and the profit margin that the company earns on its sales.
3. Problems with EVA and Accounting Rates of Return
Rate of return and economic value added have some obvious attractions as measures of performance. Unlike market-value-based measures, they show current performance and are not affected by the expectations about future events that are reflected in today’s stock market prices. Rate of return and economic value added can also be calculated for an entire company or for a particular plant or division. However, remember that both measures are based on book (balance sheet) values for assets. Debt and equity are also book values. Accountants do not show every asset on the balance sheet, yet our calculations take accounting data at face value. For example, we ignored the fact that Home Depot has invested large sums in marketing to establish its brand name. This brand name is an important asset, but its value is not shown on the balance sheet. If it were shown, the book values of assets, capital, and equity would increase, and Home Depot would not appear to earn such high returns.
EVA Dimensions, which produced the data in Tables 28.3 and 28.4, does make a number of adjustments to the accounting data. However, it is impossible to include the value of all assets or to judge how rapidly they depreciate. For example, did Microsoft really earn a return of 33% and add $16 billion of economic value? It’s difficult to say, because its investment over the years in Windows and other software is not shown on the balance sheet and cannot be measured exactly.
Remember also that the balance sheet does not show the current market values of the firm’s assets. The assets in a company’s books are valued at their original cost less any depreciation. Older assets may be grossly undervalued in today’s market conditions and prices. So a high return on assets indicates that the business has performed well by making profitable investments in the past, but it does not necessarily mean that you could buy the same assets today at their reported book values. Conversely, a low return suggests some poor decisions in the past, but it does not always mean that today the assets could be employed better elsewhere.
Utterly indited content material, Really enjoyed reading through.