Investors regularly trade options on common stocks.[1] For example, Table 20.1 reproduces quotes for options on the stock of Amazon.com. You can see that there are two types of options—calls and puts. We explain each in turn.
1. Call Options and Position Diagrams
A call option gives its owner the right to buy stock at a specified exercise or strike price on or before a specified maturity date. If the option can be exercised only at maturity, it is conventionally known as a European call; in other cases (such as the Amazon options shown in Table 20.1), the option can be exercised on or at any time before maturity, and it is then known as an American call.
The third column of Table 20.1 sets out the prices in April 2017 of Amazon call options with different exercise prices and exercise dates. Look at the quotes for options maturing in July 2017. The first entry says that for $95.58 you could acquire an option to buy one share[2] of Amazon stock for $820 on or before July 2017. Moving down to the next row, you can see that an option to buy for $40 more ($860 vs. $820) costs nearly $30 less, that is, $66.03. In general, the value of a call option goes down as the exercise price goes up. The more that you need to pay to acquire the stock, the less valuable is the option.
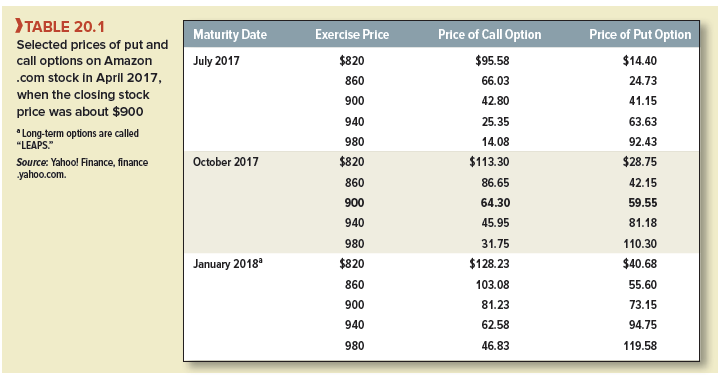
Now look at the quotes for options maturing in October 2017 and January 2018. Notice how the option price increases as option maturity is extended. For example, at an exercise price of $900, the July 2017 call option costs $42.80, the October 2017 option costs $64.30, and the January 2018 option costs $81.23. The longer you have to decide whether you want to exercise, the more valuable is the option.
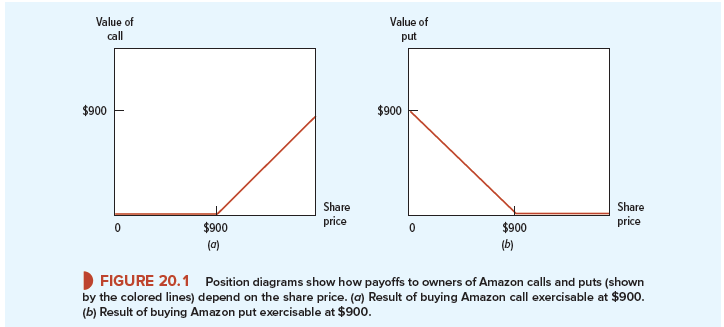
Option analysts often draw a position diagram to illustrate the possible payoffs from an option. For example, the position diagram in Figure 20.1a shows the possible consequences of investing in Amazon October 2017 call options with an exercise price of $900 (boldfaced in Table 20.1). The outcome from investing in Amazon calls depends on what happens to the stock price. If the stock price at the end of this six-month period turns out to be less than the $900 exercise price, it will not make sense to pay the exercise price to obtain the share. Your call will, in that case, be worthless. On the other hand, if the stock price turns out to be greater than $900, it will pay to exercise your option to buy the share. In this case, when the call expires, it will be worth the market price of the share minus the $900 that you must pay to exercise the option. For example, suppose that the price of Amazon stock rises to $980. Your call will then be worth $980 – $900 = $80. That is your payoff, but of course, it is not all profit. Table 20.1 shows that you had to pay $64.30 to buy the call.
2. Put Options
Now let us look at the Amazon put options in the right-hand column of Table 20.1. Whereas a call option gives you the right to buy a share for a specified exercise price, a put gives you the right to sell the share. For example, the boldfaced entry in the right-hand column of Table 20.1 shows that for $59.55, you could acquire an option to sell Amazon stock for a price of $900 any time before October 2017. The circumstances in which the put turns out to be valuable are just the opposite of those in which the call is profitable. You can see this from the position diagram in Figure 20.1b. If Amazon’s share price immediately before expiration turns out to be greater than $900, you won’t want to sell stock at that price. You would do better to sell the share in the market, and your put option will be worthless. Conversely, if the share price turns out to be less than $900, it will pay to buy stock at the low price and then take advantage of the option to sell it for $900. In this case, the value of the put option on the exercise date is the difference between the $900 proceeds of the sale and the market price of the share. For example, if the share is worth $800, the put is worth $100:
Value of put option at expiration = exercise price – market price of the share
= $900 – $800 = $100
3. Selling Calls and Puts
Let us now look at the position of an investor who sells these investments. If you sell, or “write,” a call, you promise to deliver shares if asked to do so by the call buyer. In other words, the buyer’s asset is the seller’s liability. If the share price is below the exercise price when the option matures, the buyer will not exercise the call and the seller’s liability will be zero. If it rises above the exercise price, the buyer will exercise and the seller must give up the shares. The seller loses the difference between the share price and the exercise price received from the buyer. Notice that it is the buyer who always has the option to exercise; option sellers simply do as they are told.
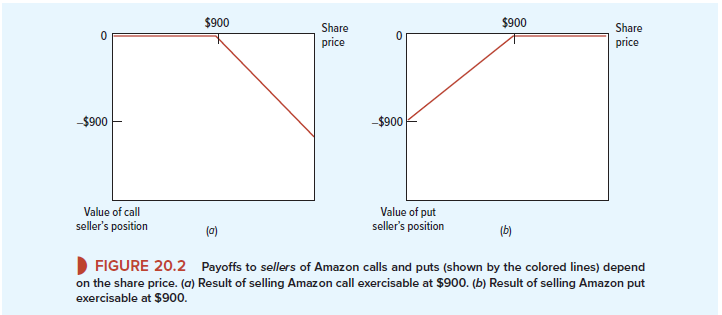
Suppose that the price of Amazon stock turns out to be $980, which is above the option’s exercise price of $900. In this case, the buyer will exercise the call. The seller is forced to sell stock worth $980 for only $900 and so has a payoff of – $80.4 Of course, that $80 loss is the buyer’s gain. Figure 20.2a shows how the payoffs to the seller of the Amazon call option vary with the stock price. Notice that for every dollar the buyer makes, the seller loses a dollar. Figure 20.2a is just Figure 20.1a drawn upside down.
In just the same way, we can depict the position of an investor who sells, or writes, a put by standing Figure 20.1b on its head. The seller of the put has agreed to pay $900 for the share if the buyer of the put should request it. Clearly the seller will be safe as long as the share price remains above $900 but will lose money if the share price falls below this figure. The worst thing that can happen is that the stock becomes worthless. The seller would then be obliged to pay $900 for a stock worth $0. The payoff to the seller would be -$900.
4. Position Diagrams Are Not Profit Diagrams
Position diagrams show only the payoffs at option exercise; they do not account for the initial cost of buying the option or the initial proceeds from selling it.
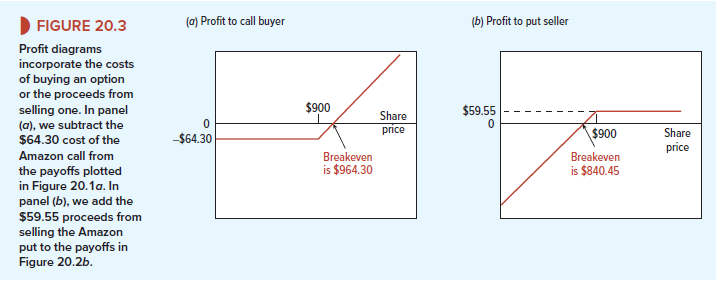
This is a common point of confusion. For example, the position diagram in Figure 20.1a makes purchase of a call look like a sure thing—the payoff is at worst zero, with plenty of upside if Amazon’s stock price goes above $900 by October 2017. But compare the profit diagram in Figure 20.3a, which subtracts the $64.30 cost of the call in April 2017 from the payoff at maturity. The call buyer loses money at all share prices less than $900 + 64.30 = $964.30. Take another example: The position diagram in Figure 20.2b makes selling a put look like a sure loss—the best payoff is zero. But the profit diagram in Figure 20.3b, which recognizes the $59.55 received by the seller, shows that the seller gains at all prices above $900 – 59.55 = $840.45.[3]
Profit diagrams like those in Figure 20.3 may be helpful to the options beginner, but options experts rarely draw them.[4] Now that you’ve graduated from the first options class we won’t draw them either. We stick to position diagrams, because you have to focus on payoffs at exercise to understand options and to value them properly.
Very great post. I simply stumbled upon your weblog and wanted to say that I have really enjoyed browsing your weblog posts. After all I’ll be subscribing for your rss feed and I hope you write again soon!