We have seen that every dollar of Home Depot’s assets generates $2.35 of sales. But a company’s success depends not only on the volume of its sales but also on how profitable those sales are. This is measured by the profit margin.
Profit Margin The profit margin measures the proportion of sales that finds its way into profits. It is sometimes defined as
![]()
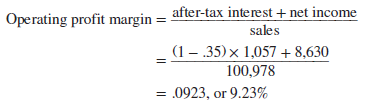
This definition can be misleading. When companies are partly financed by debt, a portion of the profits from the sales must be paid as interest to the firm’s lenders. We would not want to say that a firm is less profitable than its rivals simply because it employs debt finance and pays out part of its profits as interest. Therefore, when we are calculating the profit margin, it is useful to add back the after-tax debt interest to net income. This gives an alternative measure of profit margin, which is called the operating profit margin:
1. The Du Pont System
We calculated earlier that Home Depot has earned a return of 21.7% on its assets. The following equation shows that this return depends on two factors—the sales that the company generates from its assets (asset turnover) and the profit that it earns on each dollar of sales (operating profit margin):
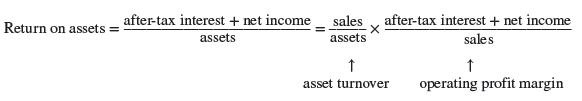
This breakdown of ROA into the product of asset turnover and margin is often called the Du Pont formula, after the chemical company that popularized the formula. In Home Depot’s case, the formula gives the following breakdown of ROA:
ROA = asset turnover x operating profit margin = 2.35 X .0923 = .217
All firms would like to earn a higher return on their assets, but their ability to do so is limited by competition. The Du Pont formula helps to identify the constraints that firms face. Fast- food chains, which have high asset turnover, tend to operate on low margins. Classy hotels have relatively low turnover ratios but tend to compensate with higher margins.
Firms often seek to improve their profit margins by acquiring a supplier. The idea is to capture the supplier’s profit as well as their own. Unfortunately, unless they have some special skill in running the new business, any gain in profit margin is offset by a decline in asset turnover. Other things equal, vertical integration brings higher profit margins and lower asset turnover.
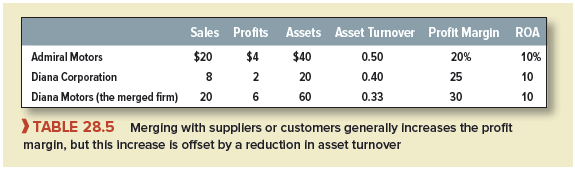
A few numbers may help to illustrate this point. Table 28.5 shows the sales, profits, and assets of Admiral Motors and its components supplier, Diana Corporation. Both earn a 10% return on assets, though Admiral has a lower operating profit margin (20% versus Diana’s 25%). Since all of Diana’s output goes to Admiral, Admiral’s management reasons that it would be better to merge the two companies. That way, the merged company would capture the profit margin on both the auto components and the assembled car.
The bottom row of Table 28.5 shows the effect of the merger. The merged firm does indeed earn the combined profits. Total sales remain at $20 million, however, because all the components produced by Diana are used within the company. With higher profits and unchanged sales, the profit margin increases. Unfortunately, the asset turnover is reduced by the merger since the merged firm has more assets. This exactly offsets the benefit of the higher profit margin. The return on assets is unchanged.
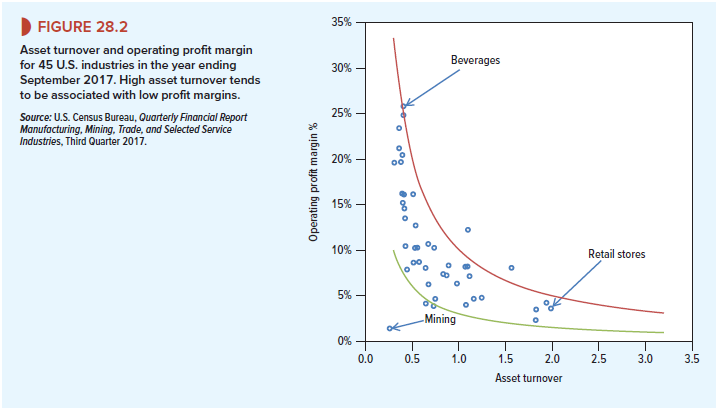
Figure 28.2 shows evidence of the trade-off between asset turnover and operating profit margin. You can see that industries with high average turnover ratios tend to have lower average profit margins. Conversely, high margins are typically associated with low turnover. The two curved lines in the figure trace out the combinations of profit margin and turnover that result in an ROA of either 3% or 10%. Despite the enormous dispersion across industries in both margin and turnover, that variation tends to be offsetting, so for most industries, the return on assets lies between 3% and 10%. The notable exception is mining, which was suffering badly in 2017 from low commodity prices.
You really make it appear really easy together with your presentation but I find this topic to be really something that I believe I’d by no means understand. It sort of feels too complex and very large for me. I am having a look ahead in your subsequent post, I?¦ll try to get the dangle of it!