1. OBTAINING DATA FROM THE INTERNET
Up to now we have taken you through various econometric methodologies and applications using already prepared EViews workfiles. In this chapter, we show you how to create a workfile and how to import data from an Excel spreadsheet. The first step is to create the Excel data file.
Getting data for economic research is much easier today than it was years ago. Before the Internet, hours would be spent in libraries, looking for and copying data by hand. Now we have access to rich data sources which are a few clicks away.
Suppose you are interested in analyzing the GDP of the United States. As suggested in Chapter 17, the website Resources for Economists contains a wide variety of data, and in particular the macro data we seek.
Websites are continually updated and improved. We shall guide you through an example, but be prepared for differences from what we show here.
First, open up the website: www.rfe.org :
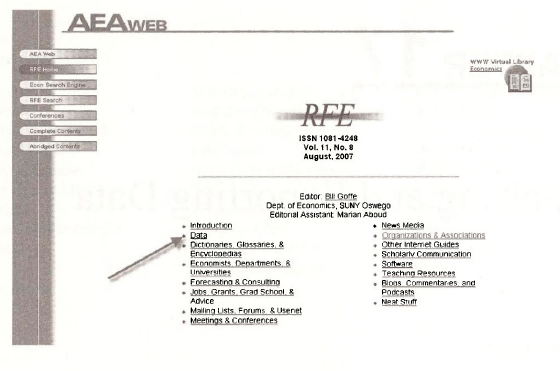
Select the Data option and then select U.S. Macro and Regional Data.
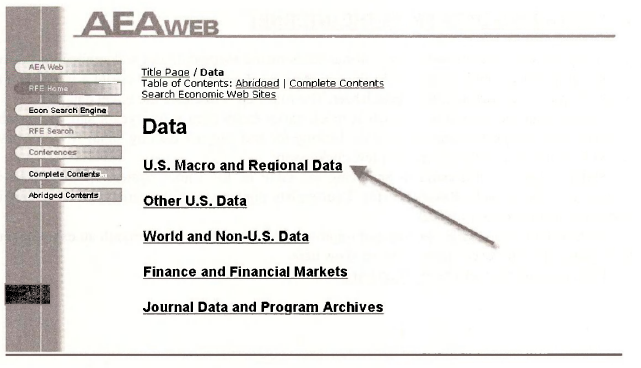
This will open up a range of sub-data categories. For the example discussed here, select the National income and Produce Accounts to get data on GDP.
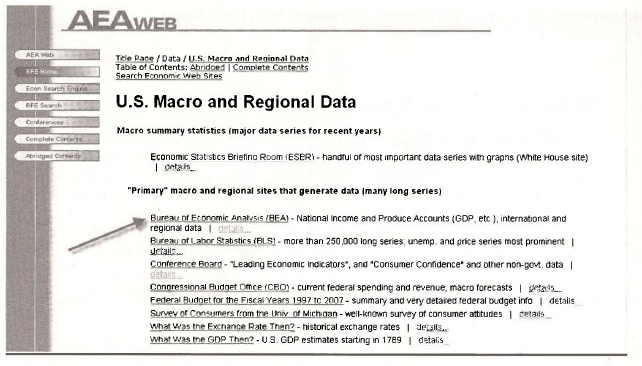
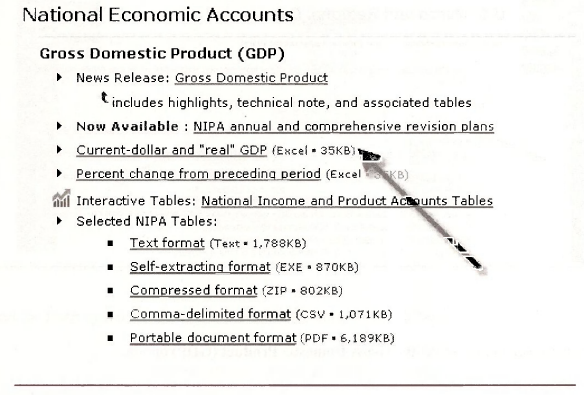
From the screen below, select the Gross Domestic Product (GDP) option.
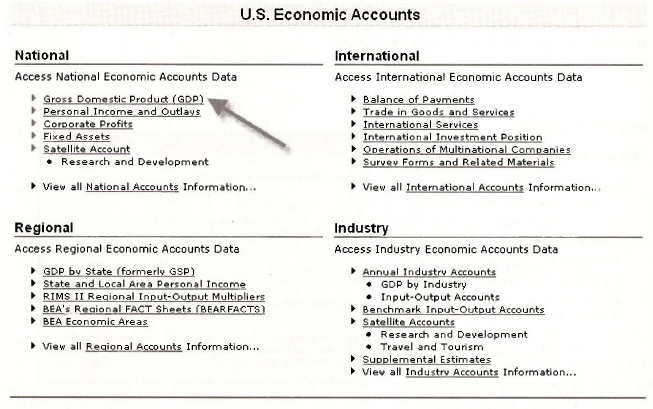
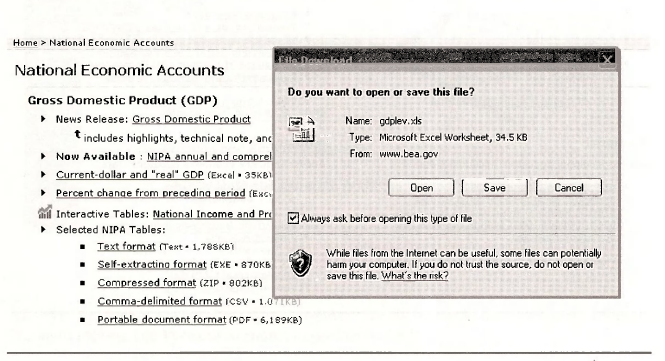
Most websites allow you to download data convenietly in an Excel format.
Be sure to save the file which is called gdplev.xls.
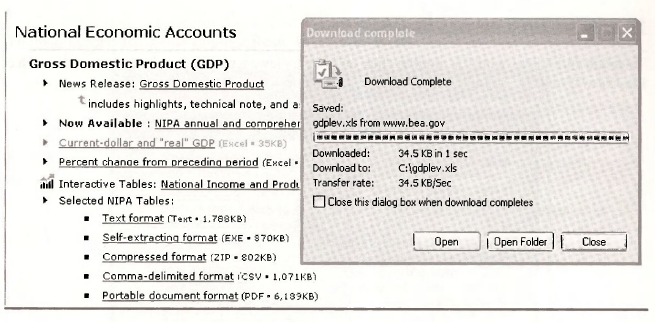
Once the file has been downloaded (in this example, to C:\gdplev.xls), we can open the file and a sample of the data in Excel format is shown below.
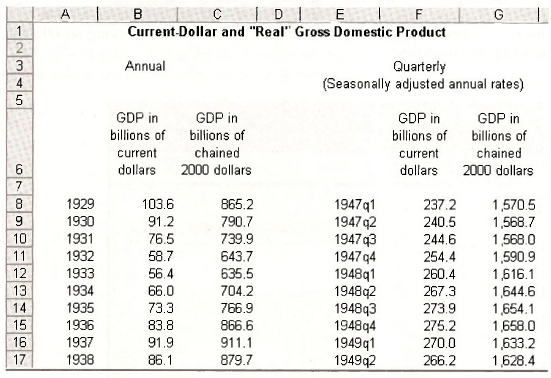
For illustrative purposes, let us now import the annual data (1929-2006) for nominal GDP (column B, first observation in cell B8) and real GDP (column C, first observation in cell C8) into an EViews workfile.
2. IMPORTING AN EXCEL DATA FILE
To create an EViews workfile, double click on your EViews icon to open the software, then select File/New/Workfile. The following screen will open up.
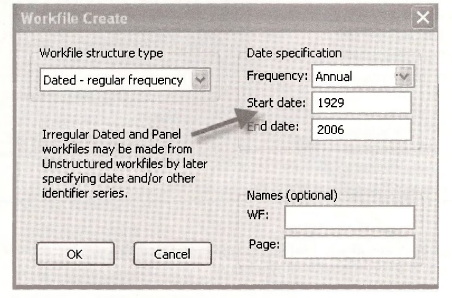
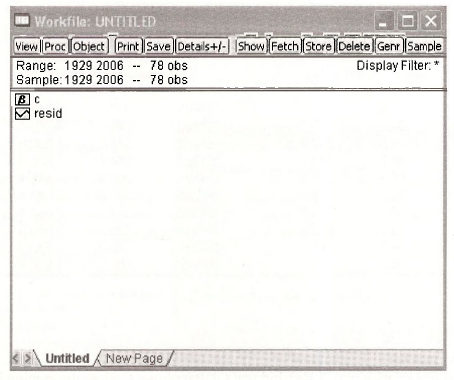
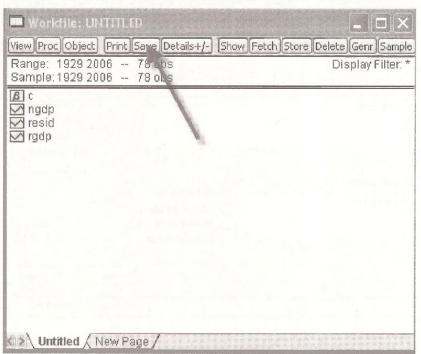
To create the workfile for annual data covering sample period 1929 to 2006, select Annual from the drop-down menu in Frequency and type in the Start and End dates. Clicking on OK will create the UNTITLED workfile below.
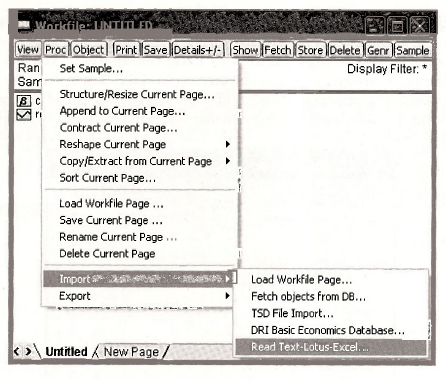
To import data select Proc/ Import/ Read Text-Lotus-Excel.
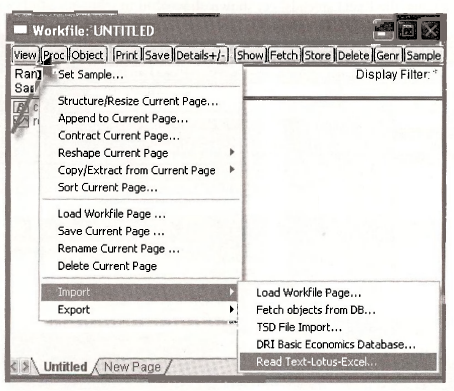
EViews will then ask you for the location of the Excel file. Open the C:\gdpdplev.xls file we have created and the following screen will open.
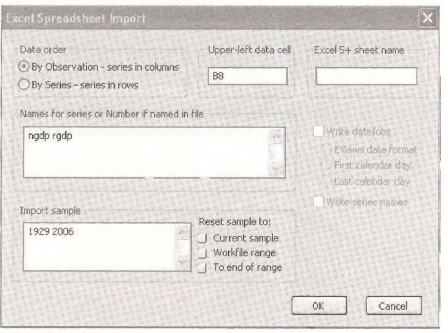
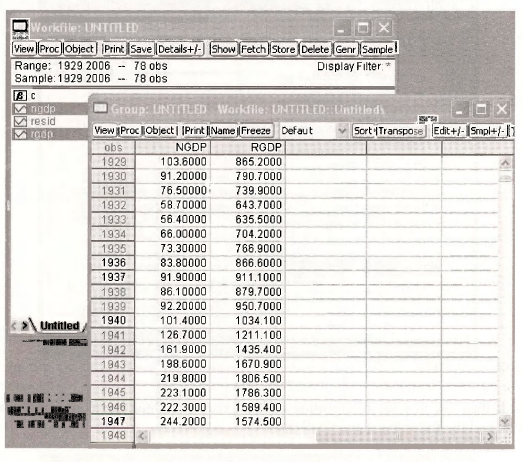
Be sure to pick the By observation – series in columns option, enter the correct location of the first observation (B8) and type in the names of the variables – in this case NGDP and RGDP.
Clicking on OK will import the data from the Excel datafile to the EViews workfile. As a check open the group NGDP and RGDP and you can see that we have successfully imported the data (do check this against the Excel spreadsheet shown above).
The final step is to save your workfile.
3. DATE CONVENTIONS
The rules for describing calendar or ordered data are:
- Annual: specify the year; for example, 1981, or 2007.
- Quarterly: the year, followed by a colon or period, and the quarter number. Examples: 1992:1,65:4, 2007:3.
- Monthly: the year, followed by a colon or period, and the month number. Examples: 1956:1,2007:11.
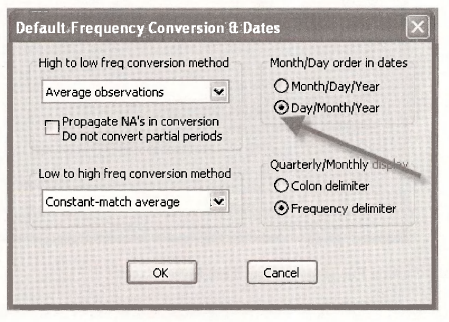
- Weekly and daily: by default, you should specify these dates as Month/Day/Year. Thus August 15, 2007 is 8/15/2007. However, you can easily change this to day/month/year using Options/Dates & Frequency Conversion.
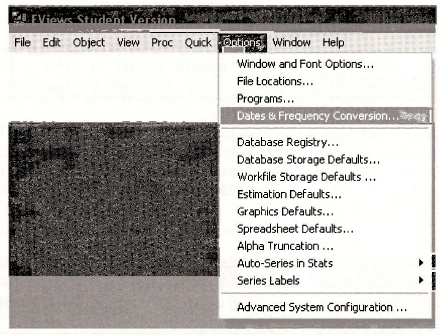
Clicking on Day/Month/Year will give you 15/8/2007.
4. IMPORTING A TEXT (ASCII) DATA FILE
Excel data files are the most common way of handling data. However, some data also come in text form and so for completeness, we shall consider the case of importing a text data file. As an illustration we will import an ASCII file called food.dat. Before trying to import the data in food.dat examine the contents of the definition file food.def It is an ASCII file that can be opened with NOTEPAD. The *.def files contain variable names and descriptions. For example, open food.def.
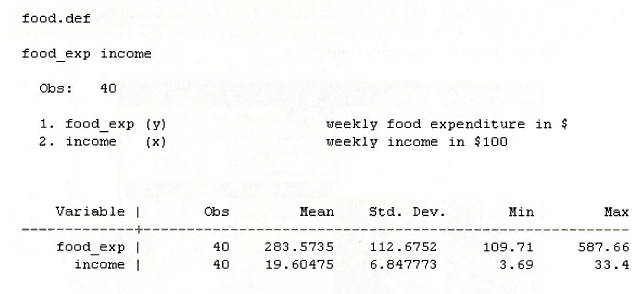
This definition file shows that there are 40 observations on two variables, Y and X, in that order, and they are weekly food expenditure and weekly income, respectively.
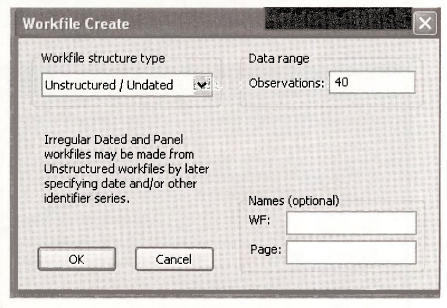
To import this data, create a workfile for 40 undated observations and click OK.
To import data, click on File/Import/Read Text-Lotus-Excel.
Use the dialog box to locate and select the file you want. Click on Open. A dialog box will open. Note at the bottom of the dialog box the first few observations in the data file are shown. Because the data file does not contain variable names, enter them as shown, and click OK. If there are a large number of long variable names, it is convenient to cut and paste them from the *.def file into the EViews window using Ctrl+C followed by Ctrl+V. The workfile will then show that two new series have been added, X and Y. Save your file
5. ENTERING DATA MANUALLY
Most of the time, data will be imported from an Excel file. However, you c directly into EYiews. As always, you must first create a workfile. Just to illustrc will create File/New/Workfile. We will assume we have annual a:
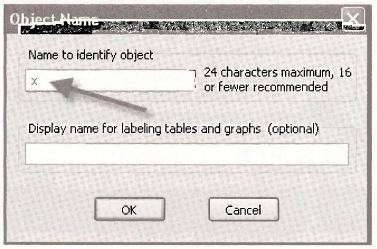
As you fill in the data, EViews will assign temporary names, SER01 and SER02, to the variables. To change those names, for example, to change SER01 to X, click open SER01, and select name:
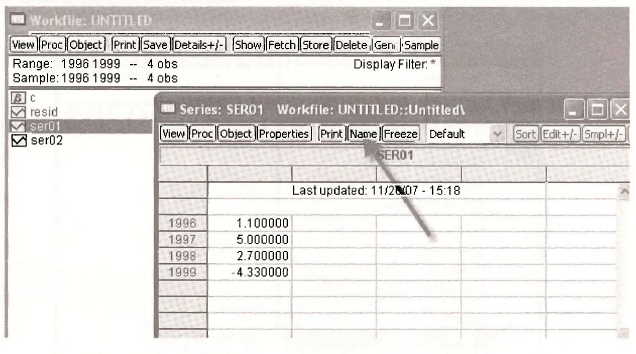
This will open the following box, and you can then type in X.
Repeat the process to change SER02 to Y. You should now find the series X and Y in your workfile.
6. EXPORTING DATA FROM EVIEWS
There are times when you would like to export data from an EViews workfile. To illustrate, let us work with food.wfl and export the two series. To do so, highlight the two series then click on Proc/Export/Write Test-Lotus-Excel.
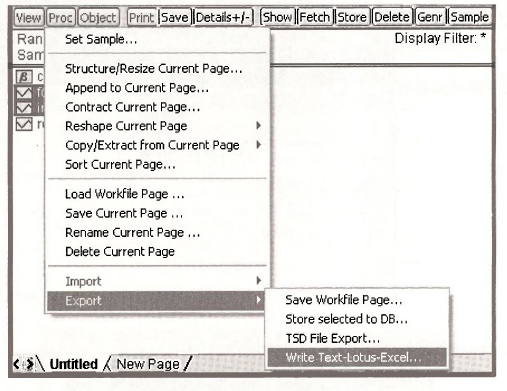
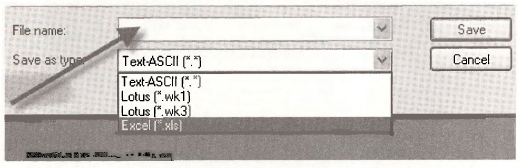
This will then open up a directory with the option to save as a text or Excel file.
Source: Griffiths William E., Hill R. Carter, Lim Mark Andrew (2008), Using EViews for Principles of Econometrics, John Wiley & Sons; 3rd Edition.
20 Sep 2021
20 Sep 2021
20 Sep 2021
20 Sep 2021
20 Sep 2021
27 Oct 2020