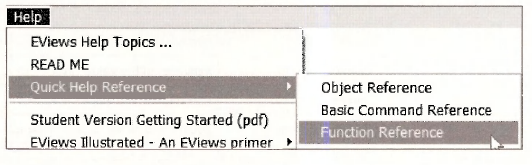
Now we will explore the use of some EViews functions. Select Help/Quick Help Reference/Function Reference.
1. Descriptive statistics functions
Select Descriptive Statistics from the list of material links.
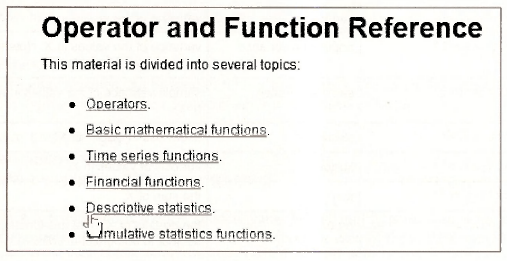
Some of the descriptive statistics functions listed there are on the next page.
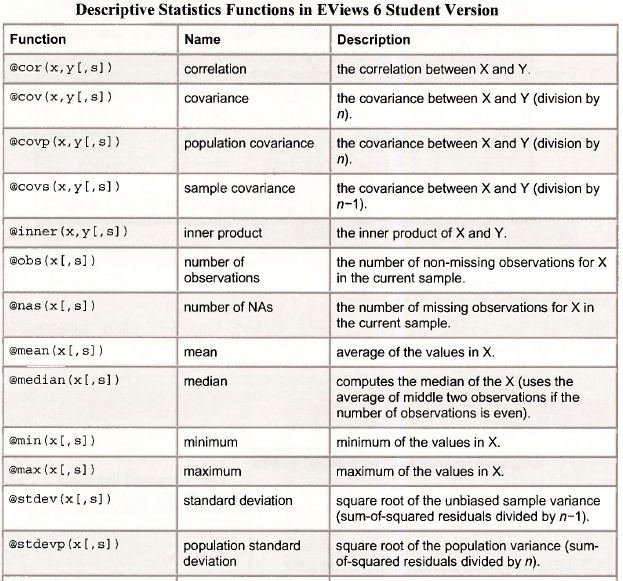
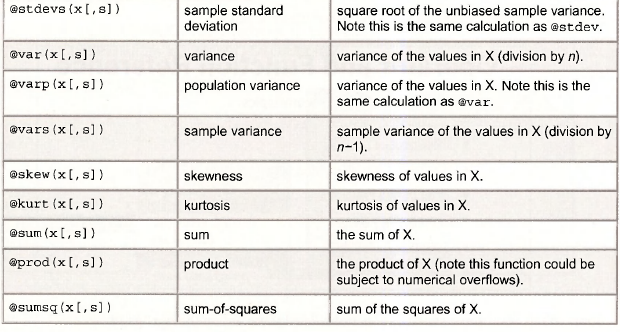
In this table of functions you will note that these functions begin with the (dr symbol. Also, these functions return a single number, which is called a scalar. In the commands the variables, or series, are called x and y. The bracket notation “[,s]” is optional and we will not use it. These functions are used by typing commands into the Command Window and pressing Enter. For example, to compute the sample mean of GDP type
scalar gdpbar = @mean(gdp).
The command window looks like this.

At the bottom of the EViews screen you will note the message
![]()
In the workfile window the new object is denote with “#” that indicates a scalar.
![]()
We called the sample mean GDPBAR because sample means are often denoted by symbols like x which is pronounced “x-bar.” In the “text messaging” world in which you live, simple but meaningful names will occur to you naturally.
To view this scalar object double click on it, or type show gdpbar in the Command window. At the bottom of the EViews screen you will see
![]()
The sample mean of GDP during the sample period is 853.305.
Scalars you have created can be used in further calculations. For example, enter the following commands by typing them into the command window and pressing Enter
scalar t = @obs(gdp)
scalar gdpse = @stdev(gdp)
scalar z = (gdpbar – 800)/(gdpse/@sqrt(t))
The value of z is 0.996, and is the test statistic value for the null hypothesis that the population mean of GDP equals 800. In the workfile are now objects for each of the scalars created.
2. Using a storage vector
The creation of scalars leads to inclusion of additional objects into the workfde, and the scalars cannot be viewed simultaneously. One solution is to create a storage vector into which these scalars can be placed.
On the EViews menu bar select Object/New Object. In the resulting dialog box select Matrix-Vector-Coef and enter an object name, say DEMO. Click OK.
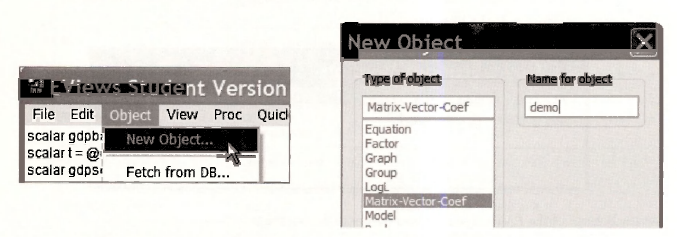
A dialog box will open asking what type of “new matrix” you want. To create a storage vector (an array) with 10 rows select the radio button Vector, enter 10 for Rows, and click OK.

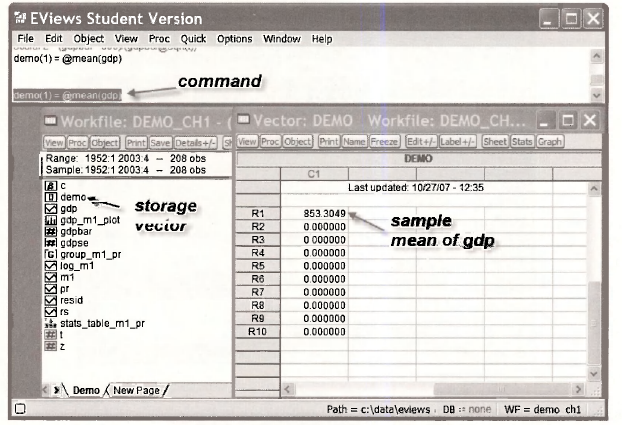
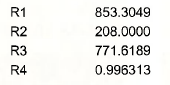
A spreadsheet will open with rows labeled R1 to RIO. Now enter into the Command window the command
demo(1) = @mean(gdp)
When you press Enter the value in row R1 will change to 853.3049, the sample mean of GDP, as shown on the next page.
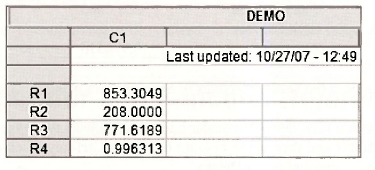
Now enter the series of commands, pressing Enter after each.
demo(2) = @obs(gdp)
demo(3) = @stdev(gdp)
demo(4) = (gdpbar – 800)/(gdpse/@sqrt(t))
Each time a command is entered a new item shows in the vector.
The advantage of this approach is that the contents of this table can be copied and pasted into a document for easy presentation. Highlight the contents, enter Ctrl+C. Choose the Formatted radio button and OK.
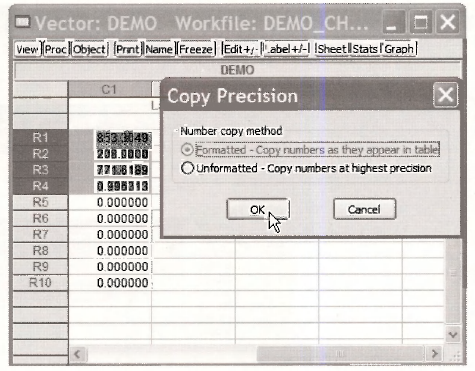
In an open document enter Ctrl+V to paste the table of results.
You can now edit as you would any table.
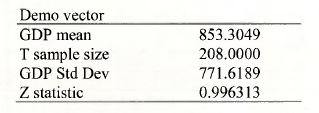
We created many tables in the book Principles of Econometrics using this method.
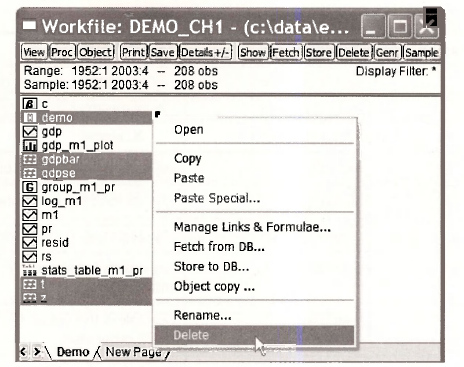
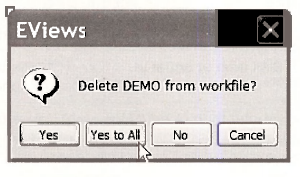
To keep our workfile tidy, delete the scalar and vector objects that have no further use. Click the vector object DEMO and then while holding down the Ctrl-key, click on the scalars. Right- click in the blue-shaded area and select Delete.
If you feel confident you can choose Yes to All
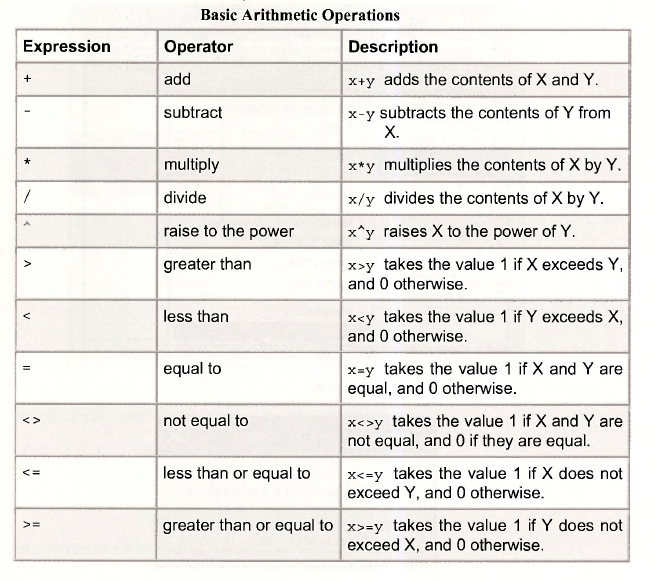
3. Basic arithmetic operations
The basic arithmetic operations can be viewed at Help/Quick Help Reference/Function Reference
The list of operators is given on the next page. These operators can be used when working with series, such as in an operation to generate a new series, RATIOl, such as 3 times the ratio of GDP to Ml:
series ratiol = 3*(gdp/m1)
4. Basic math functions
The basic math functions can be viewed at Help/Quick Help Reference/Function Reference
Some of these functions are listed below. Note that common ones like the absolute value (abs), the exponential function (exp), the natural logarithm (log) and the square root (sqr) can be used with or without the @ sign.

Source: Griffiths William E., Hill R. Carter, Lim Mark Andrew (2008), Using EViews for Principles of Econometrics, John Wiley & Sons; 3rd Edition.
Right here is the right website for anybody who really wants to understand this topic.
You understand a whole lot its almost hard to argue with you (not
that I really would want to…HaHa). You certainly put a new spin on a subject that’s been written about
for many years. Excellent stuff, just great!
You have made some good points there. I looked on the web for additional
information about the issue and found most people will go along with your views
on this website.
I am extremely impressed with your writing skills and also with the layout on your blog.
Is this a paid theme or did you customize it yourself?
Either way keep up the nice quality writing, it is rare to see a nice blog like this one nowadays.
Awesome! Its really remarkable piece of writing, I have got much clear idea regarding from this paragraph.