The volume-related indexes and oscillators we have just discussed are based, in part, on the number of shares or contracts traded over a specific period of time. In the futures market, the total number of contracts outstanding is another important factor. The number of outstanding futures contracts is called open interest.
1. What Is Open Interest?
In the futures markets, only contracts trade, not physical instruments or items. At the expiration of the specific futures market delivery month, the number of contracts reduces to zero as buyers and sellers “roll” their contracts into the next expiration or make or take delivery of the product or cash as the contracts require. The number of contracts outstanding at any one time in each delivery month is its open interest. Total open interest is the number of contracts outstanding in all delivery months. It is an excellent tool in estimating the liquidity of most contracts. However, open interest is a different figure from volume. Volume is the number of contracts traded during a certain period in a specific futures market delivery month, not the number of contracts outstanding.
Although open interest is a good tool for estimating the liquidity of a contract, using it for technical trading can be a bit tricky. One problem is that open interest rises at the beginning and declines at the expiration of each contract market. This action is often unrelated to the trend. In addition, in many futures markets, the clearinghouse takes time to calculate the open interest and actual cleared volume. The figures are only available to the public on the following morning.
2. Open Interest Indicators
Futures contracts are created as interest develops in the specific futures market and become eliminated as interest in the futures market recedes. Thus, the conventional interpretation of open interest is that expanding open interest confirms interest in the existing trend of the futures contract price. This expansion should also be accompanied by increasing volume. Expanding open interest and volume during an upward trend, for example, suggests buyers are creating more new contracts than old contracts. When the upward trend continues but open interest and volume decline, old contract holders are selling and absorbing any new buyers, suggesting that the trend may soon reverse direction. In a correction within an upward trend, declining open interest and volume suggest that the major trend is still healthy. In this sense, open interest is used similarly to volume.
Larry Williams believes that open interest reflects the commercials because they account for such a substantial percentage of volume activity. Commercials are generally short futures contracts used to hedge against inventory. Thus, a decline in open interest, he reasons, is a sign that commercials are covering shorts and that the price will likely rise. He warns that this strategy should only be used in a trading range, and that a 30% change in open interest is necessary before action is contemplated. Colby argues that Williams’s strategy does not work in the stock index futures, but he did not test the requirement for a range only.
As we know from Chapter 7, “Sentiment,” the Commodity Futures Trading Commission’s Commitment of Traders Reports provide breakdowns in open interest by category of trader. Some analysts have compared this data with the data reported daily by the commodity exchanges and used the resulting ratios and changes as indicators of professional and amateur trading action (Greco, 2001). These relations and calculations are complicated and go beyond our present scope.
3. Herrick Payoff Index (Oscillator)
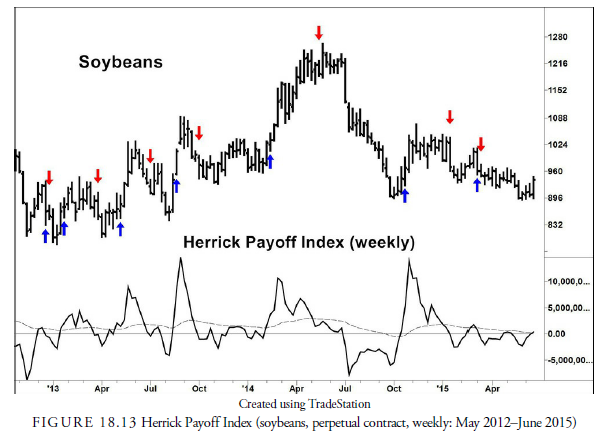
John Herrick (1982) developed a complex oscillator based on price, volume, and open interest to show the money flow in and out of a commodity future. As in many oscillators, interpretation is based on whether the index is above or below zero and whether divergences exist between volume and open interest and price velocity. Thomas Aspray (Stocks & Commodities Magazine, V.6:3, 115-118) has also found that in the Herrick Payoff Index, trend lines are often informative for warnings of a change in price direction, as are the penetration of support and resistance levels.
Figure 18.13 of soybean futures displays the Herrick Payoff Index (HPI) and its 48-week EMA. Signals traditionally were generated when the HPI crossed the zero line, but more recently an exponential moving average (EMA) has been used as the crossover line. Soybeans have some erratic moves over the period especially in 2013, and display several whipsaws. These losses were minimal compared to the large gains when the index caught the upward and downward trend in 2014. Minor crossovers could be reduced by using a filter around the EMA. Overall, the results are favorable and can easily be optimized.
4. Other Open Interest Indicators
A number of combinations of open interest, price, and volume have been proposed. Most demonstrate what the Herrick Payoff Index displays, and the methods of analysis are the same as for other oscillators. One example is the On Balance Open Interest Indicator. William Painter proposed this indicator, which uses open interest instead of volume in a Price and Open Interest Index (POI), proposed by R. Earle Hadady (1989). This index is calculated similarly to the Price and Volume Indicator using the change in price times the change in open interest.
Source: Kirkpatrick II Charles D., Dahlquist Julie R. (2015), Technical Analysis: The Complete Resource for Financial Market Technicians, FT Press; 3rd edition.
I see something genuinely special in this web site.