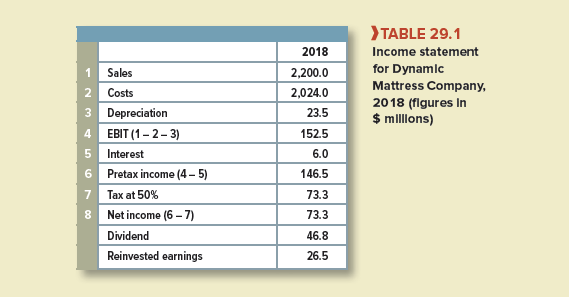
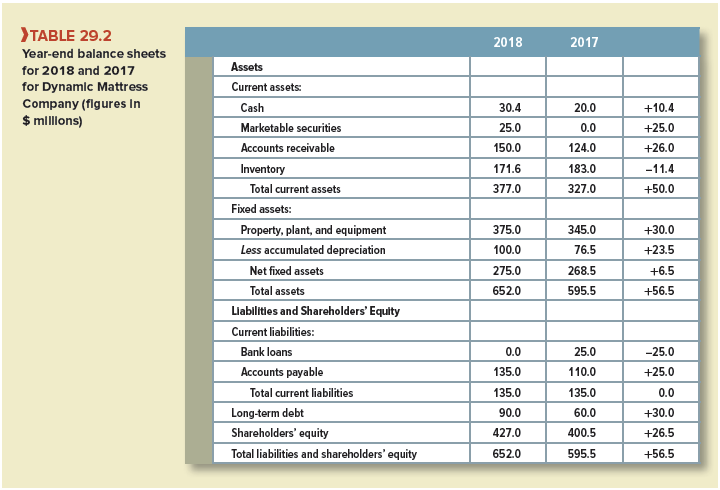
Table 29.1 shows the 2018 income statement for Dynamic Mattress Company, and Table 29.2 compares the firm’s 2017 and 2018 year-end balance sheets. You can see that Dynamic’s cash balance increased from $20 million to $30.4 million in 2018.
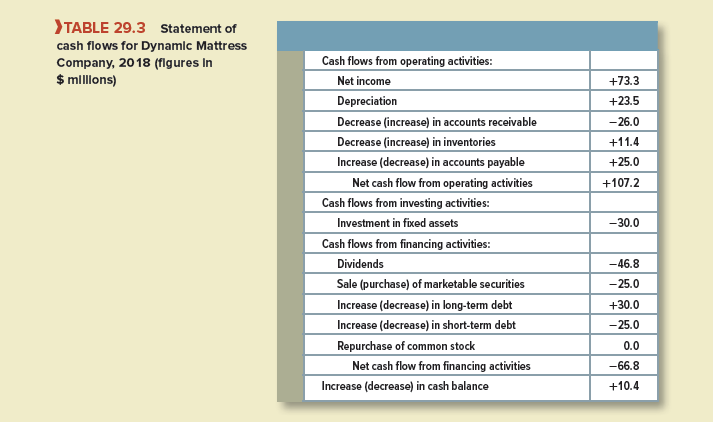
What caused this increase? Did the extra cash come from Dynamic’s issue of long-term debt, from reinvested earnings, from cash released by reducing inventory, or from extra credit extended by Dynamic’s suppliers? (Note the increase in accounts payable.) The answer is provided in the company’s cash flow statement shown in Table 29.3. A positive sign in the table shows that the activity increased the company’s cash balance; a negative sign shows that it reduced the cash balance.
Cash flow statements classify cash flows into those from operating activities, investing activities, and financing activities. Sources of cash are shown as positive numbers; uses of cash are shown as negative numbers. Dynamic’s cash flow statement shows that Dynamic generated cash from the following sources:
- It earned $73.3 million of net income (operating activity).
- It set aside $23.5 million as depreciation. Remember that depreciation is nota cash outlay. Thus, it must be added back to obtain Dynamic’s cash flow (operating activity).
- It reduced inventory, releasing $11.4 million (operating activity).
- It increased its accounts payable, in effect borrowing an additional $25 million from its suppliers (operating activity).
- It issued $30 million of long-term debt (financing activity).
Dynamic’s cash flow statement shows that it used cash for the following purposes:
- It allowed accounts receivable to expand by $26 million (operating activity). In effect, it lent this additional amount to its customers.
- It invested $30 million (investing activity). This shows up as the increase in gross fixed assets in Table 29.2.
- It paid a $46.8 million dividend (financing activity). (Note:The $26.5 million increase in Dynamic’s equity in Table 29.2 is due to reinvested earnings: $73.3 million of equity income, less the $46.8 million dividend.)
- It purchased $25 million of marketable securities (financing activity).
- It repaid $25 million of short-term bank debt (financing activity).[1]
Look again at Table 29.3. Notice that to calculate cash flows from operating activities, we start with net income and then make two adjustments. First, since depreciation is not a cash outlay, we must add it back to net income.[2] Second, we need to recognize the fact that the income statement shows sales and expenditures when they are made, rather than when cash changes hands. For example, think of what happens when Dynamic sells goods on credit. The company records a profit at the time of sale, but there is no cash inflow until the bills are paid. Because there is no cash inflow, there is no change in the company’s cash balance, although there is an increase in working capital in the form of an increase in accounts receivable. No net addition to cash would be shown in a cash flow statement like Table 29.3. The increase in cash from operations would be offset by an increase in accounts receivable. Later, when the bills are paid, there is an increase in the cash balance. However, there is no further profit at this point and no increase in working capital. The increase in the cash balance is exactly matched by a decrease in accounts receivable.
Table 29.3 adjusts the cash flow from operating activities downward by $26 million to reflect the additional credit that Dynamic has extended to its customers. On the other hand, in 2018 Dynamic reduced its inventories and increased the amount that is owed to its suppliers. The cash flow from operating activities is adjusted upward to reflect these changes.
If you draw up a balance sheet at the beginning of the process, you see cash. If you delay a little, you find the cash replaced by inventories of raw materials and, still later, by inventories
of finished goods. When the goods are sold, the inventories give way to accounts receivable, and, finally, when the customers pay their bills, the firm draws out its profit and replenishes the cash balance.
There is only one constant in this process—namely, working capital. That is one reason (net) working capital is a useful summary measure of current assets and liabilities. The strength of the working capital measure is that it is unaffected by seasonal or other temporary movements between different current assets or liabilities. But the strength is also its weakness, for the working capital figure hides a lot of interesting information. In our example, cash was transformed into inventory, then into receivables, and back into cash again. But these assets have different degrees of risk and liquidity. You can’t pay bills with inventory or with receivables. You must pay with cash.
1. The Cash Cycle
Think about the regular financing that Dynamic needs in order to maintain regular operations. The company conducts a very simple business. It buys raw materials for cash, processes them into finished goods, and then sells these goods on credit. The whole cycle of operations looks like this:
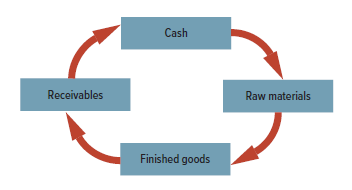
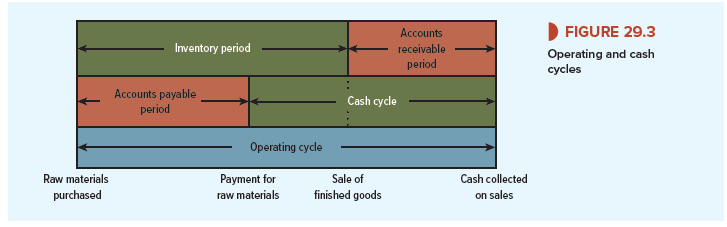
The delay between Dynamic’s initial investment in inventories and the final sale date is called the inventory period (a measure that should be familiar to you from Chapter 28). The delay between the time that the goods are sold and when the customers finally pay their bills is the accounts receivable period (another measure that should be familiar). The total length of time from the purchase of raw materials until the final payment by the customer is termed the operating cycle:
Operating cycle = inventory period + accounts receivable period
Dynamic is not out of cash, however, for this entire cycle of operations. Although the company starts by purchasing raw materials, it does not pay for them immediately. The longer that it defers payment, the shorter the time that the firm is out of cash. The interval between the firm’s payment for its raw materials and the collection of payment from the customer is known as the cash cycle or cash conversion period:
Cash cycle = operating cycle – accounts payable period
= (inventory period + accounts receivable period) – accounts payable period
This is illustrated in Figure 29.3.
We can calculate the cash cycle for Dynamic Mattress. Suppose that it purchases materials on day 0 but does not pay for them until day 24 (payable period = 24 days). By day 29, Dynamic has converted the raw materials into finished mattresses, which are then sold (inventory period = 29). Twenty-one days later, on day 50, Dynamic’s customers pay for their purchases (receivables period = 21). Thus, cash went out of the door on day 24 and did not come back in again until day 50. For Dynamic:

It is interesting to compare Dynamic’s cash cycle with that of other U.S. corporations. Table 29.4 provides the information necessary to estimate the average cycle for manufacturing firms:[3]
Average inventory period = inventory at start of year/daily cost of goods sold = 786/(5,820/365) = 49.3 days
Average receivables period = receivables at start of year/daily sales
= 700/(6,552/365) = 39.0 days
Average payment period = payables at start of year/daily cost of goods sold = 579/(5,820/365) = 36.3 days
The cash cycle is therefore
Inventory period + receivables period – payables period = 49.3 + 39.0 – 36.3 = 52.0 days
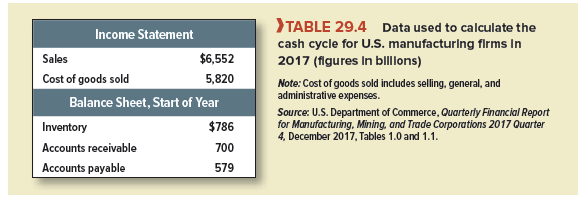
In other words, it is taking U.S. manufacturing companies an average of nearly eight weeks from the time they lay out money on inventories to collect payment from their customers. This shows up in the working capital that companies need to maintain.
Of course, the cash cycle is much longer in some businesses than in others. For example, aerospace companies typically hold large inventories and offer long payment periods. Their cash cycle is nearly six months, and they need to make a substantial investment in net working capital. By contrast, retail companies with their low investment in receivables have a cash cycle that is similar to Dynamic’s. These companies often have negative working capital.
I truly prize your piece of work, Great post.