Skip to content
    • info@phantran.net
  • Connecting and sharing with us
  • -
  • About us
    • info@phantran.net
HKT ConsultantHKT Consultant
  • Home
  • Corporate Management
    • Entrepreneurship
      • Startup
      • Entrepreneurship
      • Growth of firm
    • Managing primary activities
      • Marketing
      • Sales Management
      • Retail Management
      • Import – Export
      • International Business
      • E-commerce
      • Project Management
      • Production Management
      • Quality Management
      • Logistics Management
      • Supply Chain Management
    • Managing support activities
      • Strategy
      • Human Resource Management
      • Organizational Culture
      • Information System Management
      • Corporate Finance
      • Stock Market
      • Accounting
      • Office Management
  • Economics of Firm
    • Theory of the Firm
    • Management Science
    • Microeconomics
  • Research Methodology
    • Methodology
      • Research Process
      • Experimental Research
      • Research Philosophy
      • Management Research
      • Writing a thesis
      • Writing a paper
    • Qualitative Research
      • Literature Review
      • Interview
      • Case Study
      • Action Research
      • Qualitative Content Analysis
      • Observation
      • Phenomenology
    • Quantitative Research
      • Statistics and Econometrics
      • Questionnaire Survey
      • Quantitative Content Analysis
      • Meta Analysis
      • Statistical Software
        • STATA
        • SPSS
        • SEM-AMOS
        • SmartPLS
        • Eviews
Opening and saving SPSS datasets

This post outlines all the possible ways to open and save datasets in SPSS, that works similarly to those tasks in other computer applications. There are a few differences. Let’s have a quick look at how we can do it in SPSS. In practice, a SPSS dataset can be opened in a variety of

14
Sep
Data Coding, Entry, and Checking in SPSS: Plan the Study, Pilot Test, and Collect Data

Plan the study. The research starts with identification of a research problem and research questions or hypotheses. It is also necessary to plan the research design before you select the data collection instrument(s) and begin to collect data. Most research methods books discuss this part of the research process extensively (e.g., see Gliner, Morgan,

1 Comments

14
Sep
Data Coding, Entry, and Checking in SPSS: Code Data for Data Entry

1. Guidelines for Data Coding Coding is the process of assigning numbers to the values or levels of each variable. Before starting the coding process, we want to present some broad suggestions or rules to keep in mind as you proceed. These suggestions are adapted from rules proposed in Newton and Rudestam’s (1999) useful

14
Sep
Data Coding, Entry, and Checking in SPSS – Problem 2.1: Check the Completed Questionnaires

Now examine the incomplete, unclear, or double answers in questionnaire. Stop and do this now, before proceeding. What issues did you see? The researcher needs to make rules about how to handle these problems and note them on the questionnaires or on a master “coding instructions” sheet so that the same rules are used

14
Sep
Data Coding, Entry, and Checking in SPSS – Problem 2.2: Define and Label the Variables

The next step is to create a data file into which you will enter the data. If you do not have the program open, you need to log on. When you see the startup window, click the Type in data button; then you should see a blank Data Editor that will look something like

14
Sep
Data Coding, Entry, and Checking in SPSS – Problem 2.3: Display Your Dictionary or Codebook

Now that you have defined and labeled your variables, you can print a codebook or dictionary of your variables. It is a very useful record of what you have done. Notice that the information in the codebook is essentially the same as that in the variable view  so you do not really have to

14
Sep
Data Coding, Entry, and Checking in SPSS – Problem 2.4: Enter Data

After defining and labeling the variables, your next task is to enter the data directly from the questionnaires or from a data entry form. Sometimes researchers transfer the data from the questionnaires to a data entry form (like Table 2.1) by hand before entering the data into SPSS. This may be helpful if the questionnaires

14
Sep
Data Coding, Entry, and Checking in SPSS – Problem 2.5: Run Descriptives and Check the Data

In order to get a better “feel” for the data and to check for other types of errors or problems on the questionnaires, we recommend that you run the statistics program called Descriptives. To compute basic descriptive statistics for all your subjects, you will need to do these steps: Select Analyze  → Descriptive Statistics

14
Sep
Importing data of other software in SPSS

In this post, we will show you how to import data in SPSS by two ways: Copying and pasting data, and directly Importing data files of other software (download datasets). 1. Copying and pasting In practice, the easiest way to get data into Stata is often overlooked: you can copy data from most applications

14
Sep
Exporting anh Copying SPSS Outputs to Word or Excel

There are 2 ways to export and copy SPSS outputs to Word or Excel. We will show you how to do it. Let’s now download and open bank.sav; and open it in SPSS. We’ll use it for walking you in this post. Right. So with our data open, let’s create some output by running

14
Sep
Measurement and Descriptive Statistics with SPSS: Frequency Distributions

Frequency distributions are critical to understanding our use of measurement terms. We begin this chapter with a discussion of frequency distributions and two examples. Frequency tables and distributions can be used whether the variable involved has ordered or unordered levels or values. In this section, we only consider variables with many ordered values. A

15
Sep
Measurement and Descriptive Statistics with SPSS: Levels of Measurement

Measurement is the assignment of numbers or symbols to the different characteristics (values) of variables according to rules. In order to understand your variables, it is important to know their level of measurement. Depending on the level of measurement of a variable, the data can mean different things. For example, the number 2 might

1 Comments

15
Sep
Measurement and Descriptive Statistics with SPSS: Descriptive Statistics and Plots

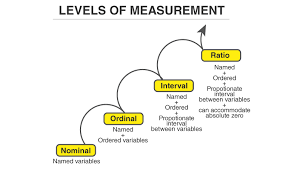
Now we expand our discussion of frequency distributions to include frequency tables, which are constructed in very similar ways for all four types of measurement. A difference is that with nominal data, the order in which the categories are listed is arbitrary. In Fig. 3.3, the frequency table listed protestant, catholic, and then not religious. However, protestant could be put after or between catholic and not religious because the categories are not ordered. In ordinal and approximately normal data, the order cannot vary (e.g., medium always should be between low and

15
Sep
Measurement and Descriptive Statistics with SPSS: The Normal Curve

Figure 3.10 is an example of a normal curve. The frequency distributions of many of the variables used in the behavioral sciences are distributed approximately as a normal curve when N is large. Examples of such variables that approximately fit a normal curve are height, weight, intelligence, and many personality variables. Notice that for

15
Sep
Exploratory Data Analysis (EDA) with SPSS

1. What Is EDA? After the data are entered into this program, the first step to complete (before running any inferential statistics) is EDA, which involves computing various descriptive statistics and graphs. Exploratory data analysis is used to examine and get to know your data. Chapters 2, 3, and especially this chapter, focus on

15
Sep
Problem 4.1: Descriptive Statistics for the Ordinal and Scale Variables with SPSS

In this problem, we use all of the HSB variables that we initially labeled as ordinal or scale in the Variable View. With those types of variables, it is important to see if the means make sense (are they close to what you expected?), to examine the dispersion/spread of the data, and to check

2 Comments

15
Sep
Problem 4.2: Boxplots for One Variable and for Multiple Variables with SPSS

In addition to numerical methods for understanding your data, there are several graphic methods. In Chapter 3, we demonstrated the use of histograms and also frequency polygons (line graphs) to roughly assess normality. The trouble is that visual inspection of histograms can be deceiving because some approximately normal distributions don’t look very much like

2 Comments

15
Sep
Problem 4.3: Boxplots and Stem-and-Leaf Plots Split by a Dichotomous Variable with SPSS

Now let’s make a boxplot comparing males and females on math achievement. This is similar to what we did in Chapter 3, but here we request statistics and stem-and-leaf plots. 4.3. Create a boxplot for math achievement split by gender. Use these commands: Analyze → Descriptive Statistics → Explore  The Explore window (Fig. 4.5) will

15
Sep
Problem 4.4: Descriptives for Dichotomous Variables with SPSS

Now let’s explore the dichotomous variables. To do this, we do the Descriptives command for each of the dichotomous variables. Once again, we could have done Frequencies, with or without frequency tables, but we chose Descriptives. This time we select fewer statistics because the standard deviation, variance, and skewness values are not very meaningful

15
Sep
Problem 4.5: Frequency Tables for a Few Variables with SPSS

Displaying Frequency tables for variables can help you understand how many participants are in each level of a variable and how much missing data of various types you have. For nominal variables, most descriptive statistics are meaningless. Thus, having a frequency table is usually the best way to understand your nominal variables. We created

15
Sep
  • 1
  • …
  • 176
  • 177
  • 178
  • 179
  • 180
  • 181
  • 182
  • …
  • 196
Theories of the firm
  • Plan d’actions
  • Organizational learning theoryOrganizational learning theory
  • Theory of Organizational PowerTheory of Organizational Power
  • The Invisible hand of Adam SmithThe Invisible hand of Adam Smith
  • Theory of Organizational structureTheory of Organizational structure
  • Social Theories and ConceptsSocial Theories and Concepts
  • What is a Scientific Theory?What is a Scientific Theory?
  • Transaction Cost EconomicsTransaction Cost Economics

Most Read in 30 days

Methodology & Skills
  • Learn Programming Languages (JavaScript, Python, Java, PHP, C, C#, C++, HTML, CSS)Learn Programming Languages (JavaScript, Python, Java, PHP, C, C#, C++, HTML, CSS)
  • Create your professional WordPress website without codeCreate your professional WordPress website without code
  • Research methodology: a step-by-step guide for beginnersResearch methodology: a step-by-step guide for beginners
  • Quantitative Research: Definition, Methods, Types and ExamplesQuantitative Research: Definition, Methods, Types and Examples
  • Qualitative methods: what and why use them?Qualitative methods: what and why use them?
  • Doing Management Research: A Comprehensive GuideDoing Management Research: A Comprehensive Guide
  • A Comparison of R, Python, SAS, SPSS and STATA for a Best Statistical SoftwareA Comparison of R, Python, SAS, SPSS and STATA for a Best Statistical Software

Connecting and sharing with us

... by your free and real actions.

hotlineTComment and discuss your ideas

Enthusiastic to comment and discuss the articles, videos on our website by sharing your knowledge and experiences.

hỗ trợ hkt Respect the copyright

Updating and sharing our articles and videos with sources from our channel.

hỗ trợ hkt Subscribe and like our articles and videos

Supporting us mentally and with your free and real actions on our channel.

HKT Channel - Science Theories

About HKT CHANNEL
About HKT CONSULTANT

Website Structure

Corporate Management
Startup & Entrepreneurship
Management Science
Theories of the firm

HKT Consultant JSC.

      "Knowledge - Experience - Success"
- Email: Info@phantran.net
- Website:
phantran.net

  • Home
  • Corporate Management
    • Entrepreneurship
      • Startup
      • Entrepreneurship
      • Growth of firm
    • Managing primary activities
      • Marketing
      • Sales Management
      • Retail Management
      • Import – Export
      • International Business
      • E-commerce
      • Project Management
      • Production Management
      • Quality Management
      • Logistics Management
      • Supply Chain Management
    • Managing support activities
      • Strategy
      • Human Resource Management
      • Organizational Culture
      • Information System Management
      • Corporate Finance
      • Stock Market
      • Accounting
      • Office Management
  • Economics of Firm
    • Theory of the Firm
    • Management Science
    • Microeconomics
  • Research Methodology
    • Methodology
      • Research Process
      • Experimental Research
      • Research Philosophy
      • Management Research
      • Writing a thesis
      • Writing a paper
    • Qualitative Research
      • Literature Review
      • Interview
      • Case Study
      • Action Research
      • Qualitative Content Analysis
      • Observation
      • Phenomenology
    • Quantitative Research
      • Statistics and Econometrics
      • Questionnaire Survey
      • Quantitative Content Analysis
      • Meta Analysis
      • Statistical Software
        • STATA
        • SPSS
        • SEM-AMOS
        • SmartPLS
        • Eviews
  • About us