Skip to content
    • info@phantran.net
  • Connecting and sharing with us
  • -
  • About us
    • info@phantran.net
HKT ConsultantHKT Consultant
  • Home
  • Corporate Management
    • Entrepreneurship
      • Startup
      • Entrepreneurship
      • Growth of firm
    • Managing primary activities
      • Marketing
      • Sales Management
      • Retail Management
      • Import – Export
      • International Business
      • E-commerce
      • Project Management
      • Production Management
      • Quality Management
      • Logistics Management
      • Supply Chain Management
    • Managing support activities
      • Strategy
      • Human Resource Management
      • Organizational Culture
      • Information System Management
      • Corporate Finance
      • Stock Market
      • Accounting
      • Office Management
  • Economics of Firm
    • Theory of the Firm
    • Management Science
    • Microeconomics
  • Research Methodology
    • Methodology
      • Research Process
      • Experimental Research
      • Research Philosophy
      • Management Research
      • Writing a thesis
      • Writing a paper
    • Qualitative Research
      • Literature Review
      • Interview
      • Case Study
      • Action Research
      • Qualitative Content Analysis
      • Observation
      • Phenomenology
    • Quantitative Research
      • Statistics and Econometrics
      • Questionnaire Survey
      • Quantitative Content Analysis
      • Meta Analysis
      • Statistical Software
        • STATA
        • SPSS
        • SEM-AMOS
        • SmartPLS
        • Eviews
Multiple Random Slopes by using Stata

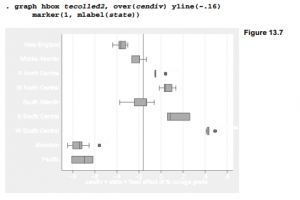
To specify random coefficients on logdens, minority and colled we can simply add these variable names to the random-effects part of an xtmixed command. For later comparison tests, we save the estimation results with name full. Some of the iteration details have been omitted in the following output. . xtmixed bush logdens minority colled

1 Comment

03
Oct
Nested Levels by using Stata

Mixed-effects models can include more than one nested level. The counties of our voting data, for example, are nested not only within census divisions, but also within states that are nested within census divisions. Might there exist random effects not only at the level of census divisions, but also at the smaller level of

1 Comment

03
Oct
Repeated Measurements by using Stata

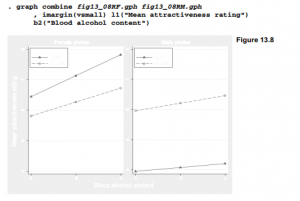
Dataset attract2.dta describes an unusual experiment carried out at a college undergraduate party, where some drinking apparently took place. In this experiment, 51 college students were asked to individually rate the attractiveness, on a scale from 1 to 10, of photographs of men and women unknown to them. The rating exercise was repeated by

03
Oct
Cross-Sectional Time Series by using Stata

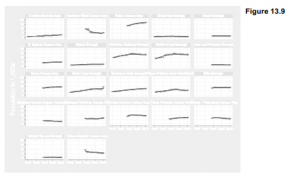
This section applies xtmixed to a different kind of multilevel data: cross-sectional time series. Dataset Alaskaregions.dta contains time series of population for each of the 27 boroughs, municipalities or census areas that together make up the state of Alaska. These 27 regions are a fragment from the pan-Arctic human-dimensions database framework described by Hamilton

03
Oct
Mixed-Effects Logit Regression by using Stata

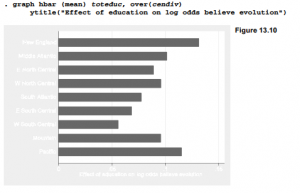
Since 1972, the General Social Survey (Davis et al. 2005) has tracked U.S. public opinion through a series of annual or biannual surveys, and made the data available for teaching and research. Dataset GSS_2010_SwS contains a small subset of variables and observations from the 2010 survey, including background variables along with answers to questions

1 Comment

03
Oct
What is panel data? and What is Panel Analysis?

What Is Panel Data? In statistics and econometrics, panel data and longitudinal data are both multi-dimensional data involving measurements over time. Panel data is a subset of longitudinal data where observations are for the same subjects each time. Time series and cross-sectional data can be thought of as special cases of panel data that are in one dimension only (one panel member or individual for

03
Oct
Fixed-Effects Regression in Panel Data Analysis using Stata

In panel data, we use fixed-effects model whenever we are only interested in analyzing the impact of variables that vary over time. This model is “designed to study the causes of changes within an entity. A time-invariant characteristic cannot cause such a change, because it is constant for each entity” (Kohler and Kreuter. 2008).

2 Comments

03
Oct
Random-Effects Regression in Panel Data Analysis using Stata

In panel data, the rationale behind random effects model is that: unlike the fixed-effects model, the variation across entities is assumed to be random and uncorrelated with the independent variables included in the model. So, “…the crucial distinction between fixed and random effects is whether the unobserved individual effect embodies elements that are correlated

3 Comments

03
Oct
Choosing Fixed-Effects, Random-Effects or Pooled OLS Models in Panel Data Analysis using Stata

This article introduces the practical process of choosing Fixed-Effects, Random-Effects or Pooled OLS Models in Panel data analysis. We will show you how to perform step by step on our panel data, from which we published the results in our article on Sustainability review in 2019 (see Nguyen Hoang Viet, Phan Thanh Tu and

3 Comments

03
Oct
The Hausman test: how to implement with Stata

The Durbin–Wu–Hausman test (also called Hausman specification test) is a statistical hypothesis test in econometrics named after James Durbin, De-Min Wu, and Jerry A. Hausman. The test evaluates the consistency of an estimator when compared to an alternative, less efficient estimator which is already known to be consistent. It helps one evaluate if a statistical model corresponds to the data. It is also applied in the context of linear

03
Oct
Lagrange Multiplier Test for Random Effects in Panel Data Analysis with Stata

In 1980, Breusch and Pagan developed a Lagrange multiplier test for random effects, so this test is also called Breusch-Pagan Lagrange Multiplier test. The test helps us choose between random-effects model regression and pooled OLS regression. In the following video, we will show you how to perform this test step by step on our

03
Oct
Basic Concepts and Tools for Programming in Stata

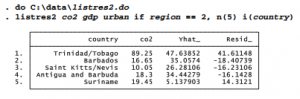
Some elementary concepts and tools, combined with the Stata capabilities described in earlier chapters, suffice to get started. 1. Do-files Do-files are text (ASCII) files, created by Stata’s Do-file Editor, a word processor, or any other text editor. They are typically saved with a .do extension. The file can contain any sequence of legitimate

1 Comment

03
Oct
Sata Example Program

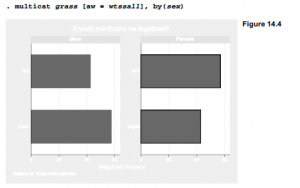
1. Example Program: multicat (Plot Many Categorical Variables) The preceding sections presented basic ideas and example short programs. In this section, we apply those ideas to a longer program that defines a new statistical procedure named multicat. Survey research produces datasets containing many categorical variables — sometimes 100 or more. Our 2010 General Social

03
Oct
Help File in Stata

Help files are an integral aspect of using Stata. For a user-written program such as multicat.ado, they become even more important because no documentation exists in the manuals. We can write a help file for multicat.ado by using Stata’s Do-file Editor to create a text file named multicat.sthlp. This help file should be saved

03
Oct
Monte Carlo Simulation by using Stata

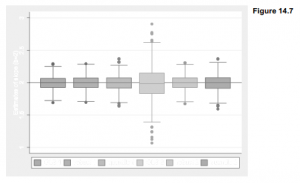
Monte Carlo simulations generate and analyze many samples of artificial data, allowing researchers to investigate the long-run behavior of their statistical techniques. The simulate command makes designing a simulation straightforward so that it only requires a small amount of additional programming. This section gives two examples. To begin a simulation, we need to define

03
Oct
Matrix Sata Programming with Mata

Stata’s matrix programming language called Mata, is described in the two-volume Mata Matrix Programming manual. This rich topic lies beyond the introductory scope of Statistics with Stata. It seems fitting, however, to conclude the book with a brief look at Mata. Its programming tools open new paths for Stata’s development. Rather than undertaking the

03
Oct
Procedural Steps in Structural Equation Modelling

Structural equation modelling includes six key steps. In addition to data collection, the steps are model specification, identification, estimation, evaluation and modification (Fig. 3.1). Model Specification: The first step in SEM analysis is the model specification. It is performed prior to data collection and data modelling. This involves the devel- opment of a theoretical

27
Mar
What Is Structural Equation Modeling?

Structural equation modeling, or SEM, is a statistical method that examines the relation- ships among numerous variables in a simultaneous way. SEM is not considered a single procedure but rather a family of related statistical techniques. This family of analysis tech- niques examines the measurement properties of a variable along with the interrelationships between

27
Mar
Basics of SEM Input: The Covariance Matrix

For the purposes of this book, I will strictly use a covariance-based approach to structural equation modeling.This method is the most robust for theory testing and assessing the “struc- ture” of a specified model along with its relationships. Before we move forward, a discussion is warranted on concepts such as variance, covariance, and correlation

27
Mar
Correlations Between Constructs in SEM Model

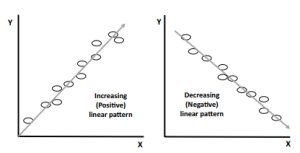
While directionality is calculated with a covariance analysis, the strength of the relationships is determined through a correlation analysis. A correlation between two concepts is essentially derived from the covariance. With a covariance analysis, the calculated values do not have a definable range or limit. If you have two variables that are measured on

27
Mar
  • 1
  • …
  • 188
  • 189
  • 190
  • 191
  • 192
  • 193
  • 194
  • …
  • 196
Theories of the firm
  • Hyper-competition theoryHyper-competition theory
  • Becoming and evolution of a scientific theoryBecoming and evolution of a scientific theory
  • Systems TheorySystems Theory
  • What is a Scientific Theory?What is a Scientific Theory?
  • Behavioral theory of the firmBehavioral theory of the firm
  • Organizational learning theoryOrganizational learning theory
  • List of Theological Belief SystemsList of Theological Belief Systems
  • Institutional TheoryInstitutional Theory

Methodology & Skills
  • Quantitative Research: Definition, Methods, Types and ExamplesQuantitative Research: Definition, Methods, Types and Examples
  • Create your professional WordPress website without codeCreate your professional WordPress website without code
  • Research methodology: a step-by-step guide for beginnersResearch methodology: a step-by-step guide for beginners
  • A Comparison of R, Python, SAS, SPSS and STATA for a Best Statistical SoftwareA Comparison of R, Python, SAS, SPSS and STATA for a Best Statistical Software
  • Qualitative methods: what and why use them?Qualitative methods: what and why use them?
  • Doing Management Research: A Comprehensive GuideDoing Management Research: A Comprehensive Guide
  • Learn Programming Languages (JavaScript, Python, Java, PHP, C, C#, C++, HTML, CSS)Learn Programming Languages (JavaScript, Python, Java, PHP, C, C#, C++, HTML, CSS)

Connecting and sharing with us

... by your free and real actions.

hotlineTComment and discuss your ideas

Enthusiastic to comment and discuss the articles, videos on our website by sharing your knowledge and experiences.

hỗ trợ hkt Respect the copyright

Updating and sharing our articles and videos with sources from our channel.

hỗ trợ hkt Subscribe and like our articles and videos

Supporting us mentally and with your free and real actions on our channel.

HKT Channel - Science Theories

About HKT CHANNEL
About HKT CONSULTANT

Website Structure

Corporate Management
Startup & Entrepreneurship
Management Science
Theories of the firm

HKT Consultant JSC.

      "Knowledge - Experience - Success"
- Email: Info@phantran.net
- Website:
phantran.net

  • Home
  • Corporate Management
    • Entrepreneurship
      • Startup
      • Entrepreneurship
      • Growth of firm
    • Managing primary activities
      • Marketing
      • Sales Management
      • Retail Management
      • Import – Export
      • International Business
      • E-commerce
      • Project Management
      • Production Management
      • Quality Management
      • Logistics Management
      • Supply Chain Management
    • Managing support activities
      • Strategy
      • Human Resource Management
      • Organizational Culture
      • Information System Management
      • Corporate Finance
      • Stock Market
      • Accounting
      • Office Management
  • Economics of Firm
    • Theory of the Firm
    • Management Science
    • Microeconomics
  • Research Methodology
    • Methodology
      • Research Process
      • Experimental Research
      • Research Philosophy
      • Management Research
      • Writing a thesis
      • Writing a paper
    • Qualitative Research
      • Literature Review
      • Interview
      • Case Study
      • Action Research
      • Qualitative Content Analysis
      • Observation
      • Phenomenology
    • Quantitative Research
      • Statistics and Econometrics
      • Questionnaire Survey
      • Quantitative Content Analysis
      • Meta Analysis
      • Statistical Software
        • STATA
        • SPSS
        • SEM-AMOS
        • SmartPLS
        • Eviews
  • About us