Skip to content
    • info@phantran.net
  • Connecting and sharing with us
  • -
  • About us
    • info@phantran.net
HKT ConsultantHKT Consultant
  • Home
  • Corporate Management
    • Entrepreneurship
      • Startup
      • Entrepreneurship
      • Growth of firm
    • Managing primary activities
      • Marketing
      • Sales Management
      • Retail Management
      • Import – Export
      • International Business
      • E-commerce
      • Project Management
      • Production Management
      • Quality Management
      • Logistics Management
      • Supply Chain Management
    • Managing support activities
      • Strategy
      • Human Resource Management
      • Organizational Culture
      • Information System Management
      • Corporate Finance
      • Stock Market
      • Accounting
      • Office Management
  • Economics of Firm
    • Theory of the Firm
    • Management Science
    • Microeconomics
  • Research Methodology
    • Methodology
      • Research Process
      • Experimental Research
      • Research Philosophy
      • Management Research
      • Writing a thesis
      • Writing a paper
    • Qualitative Research
      • Literature Review
      • Interview
      • Case Study
      • Action Research
      • Qualitative Content Analysis
      • Observation
      • Phenomenology
    • Quantitative Research
      • Statistics and Econometrics
      • Questionnaire Survey
      • Quantitative Content Analysis
      • Meta Analysis
      • Statistical Software
        • STATA
        • SPSS
        • SEM-AMOS
        • SmartPLS
        • Eviews
Generalized Linear Models by using Stata

Generalized linear models (GLM) have the form where    g[ ] is the link function and F the distribution        family. This general formulation encompasses many specific models. For example, if g[ ] is the identity function and y follows a normal (Gaussian) distribution, we have a linear regression model: If g[ ]     is the logit

1 Comment

01
Oct
Principal Component Analysis and Principal Component Factoring by using Stata

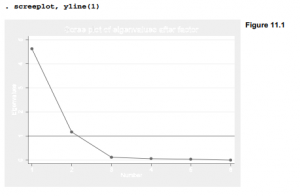
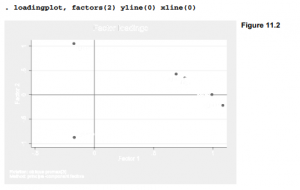
To illustrate principal component and factor analysis, we start with the small dataset, planets.dta, describing the nine classical planets of this solar system (from Beatty et al. 1981). The data include several variables in both raw and natural logarithm form. Logarithms are employed here to reduce skew and linearize relationships among the variables. Principal

1 Comment

01
Oct
Rotation by using Stata

Rotation further simplifies factor structure. After factoring, type rotate followed by an option to specify the type of rotation. Two common types are: varimax   Varimax orthogonal rotation, producing uncorrelated factors or components (default). promax( )   Promax oblique rotation, allowing correlated factors or components. Choose a number (promax power) < 4; the higher the number,

01
Oct
Factor Scores by using Stata

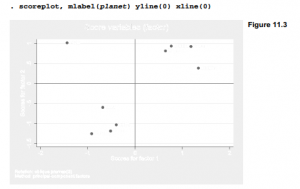
Factor scores are linear composites, formed by standardizing each variable to zero mean and unit variance, and then weighting with factor score coefficients and summing for each factor. predict performs these calculations automatically, using the most recent rotate or factor results. In the predict command we supply names for the new variables, such as

01
Oct
Different regression models with Panel data (fixed-effects, random-effects, and pooled OLS)

Panel data, also known as longitudinal or cross-sectional time-series data, is a dataset in which the behaviors of entities are observed across time. These entities could be states, companies, individuals, countries etc. Panel data allows us to control for variables we cannot observe or measure across entities; or variables that change over time but

6 Comments

01
Oct
Principal Factoring by using Stata

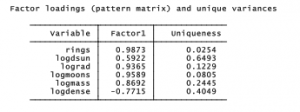
The examples above involve principal component factoring, specified by the command factor with option pcf. Other factor options perform different kinds of factor analysis. pcf       Principal component factoring pf          Principal factoring (default) ipf         Principal factoring with iterated communalities ml         Maximum-likelihood factoring Principal factoring extracts principal components from a modified correlation matrix, in

03
Oct
Maximum-Likelihood Factoring by using Stata

Maximum-likelihood factoring, unlike Stata’s other factor options, provides formal hypothesis tests that help in determining the appropriate number of factors. To obtain a single maximum- likelihood factor for the planetary data, type The ml output includes two likelihood-ratio % 2 tests: LR test: independent vs. saturated This tests whether a no-factor (independent) model fits

03
Oct
Cluster Analysis — 1

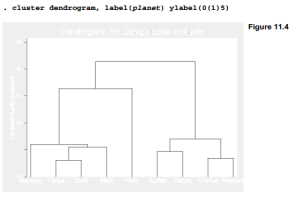
Cluster analysis encompasses a variety of methods that divide observations into groups or clusters, based on their dissimilarities across a number of variables. It is most often used as an exploratory approach, for developing empirical typologies, rather than as a means of testing pre­specified hypotheses. Indeed, there exists little formal theory to guide hypothesis

03
Oct
Cluster Analysis — 2

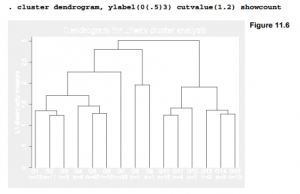
Discovering a simple, robust typology to describe nine planets was straightforward. For a more challenging example, consider the cross-national data in Nations2.dta. These United Nations human-development variables could be applied to develop an empirical typology of nations. . use C:\data\Natlons2.dta, clear Working with the same data in Chapter7, we saw that nonlinear transformations such

03
Oct
Using Factor Scores in Regression by using Stata

Principal components and factor analysis often help to define new composite variables for further analysis. For example, the factor scores calculated by predict could become independent or dependent variables in subsequent regression analyses. To illustrate this process we turn to the survey dataset PNWsurvey211.dta. The 16 variables in this dataset represent a subset from

1 Comment

03
Oct
Measurement and Structural Equation Models by using Stata

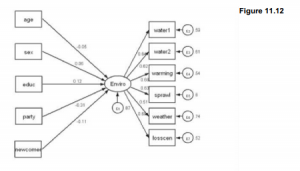
Chapter 8 took a first look at structural equation modeling, beginning with a regression-like example involving relationships among observed variables (Figure 8.15). Structural equation models can also incorporate measurement models, which resemble factor analysis. Measurement models posit one or more unobserved, factor-like latent variables that cause variation in observed variables. Figure 11.10 illustrates using

03
Oct
Smoothing by using Stata

Many time series exhibit high-frequency variations that make it difficult to discern underlying patterns. Smoothing such series breaks the data into two parts, one that varies gradually, and a second “rough” part containing the leftover rapid changes: data = smooth + rough To illustrate smoothing methods, we examine data on daily water consumption for

1 Comment

03
Oct
Further Time Plot Examples by using Stata

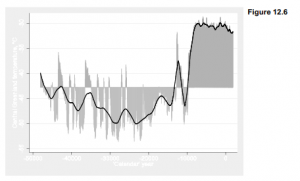
Dataset Greenland temperature.dta contains a famous time series of temperature estimates reconstructed from the GISP2 ice core in central Greenland, covering time from about 50,000 years ago up through 1855 (Alley 2004). In scientific publications on these data, time has been represented by the variable age, in units of thousands of years before present.

03
Oct
Recent Climate Change by using Stata

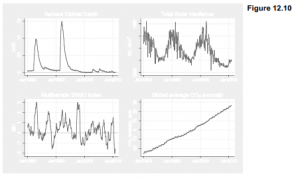
Shifting scale from thousands of years to only the past thirty, the rest of this chapter looks at how climate has changed recently. Dataset Climate.dta contains three time series estimating monthly global temperatures from 1980 through 2010, along with four possible drivers or causes of temperature. Two of the temperature indexes derive from surface-temperature

03
Oct
Leads, Lags and Differences by using Stata

Time series analysis often involves lagged variables, or values from previous times. Lags can be specified by explicit subscripting. For example, the following command creates variable mei l, equal to the previous month’s Multivariate ENSO Index (mei) value: . generate mei_1 = mei[_n-1] Alternatively, we could accomplish the same thing, using tsset data, with

03
Oct
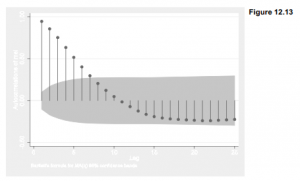
Correlograms by using Stata

Autocorrelation coefficients estimate the correlation between a variable and itself at particular lags. For example, first-order autocorrelation is the correlation between y t and y t-1 . Second order refers to Cor[ yt,y t-2], and so forth. A correlogram graphs correlation versus lag. Stata’s corrgram command provides simple correlograms and related information. The maximum

03
Oct
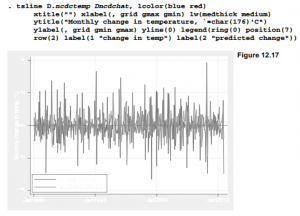
ARIMA Models by using Stata

Autoregressive integrated moving average (ARIMA) models can be estimated through the arima command. This command encompasses autoregressive (AR), moving average (MA), or ARIMA models. It also can estimate structural models that include one or more predictor variables and ARIMA disturbances. These are termed ARMAX models, for autoregressive moving average with exogenous variables. The general

1 Comment

03
Oct
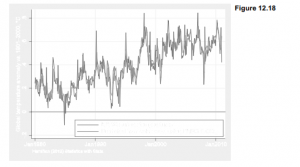
ARMAX Models by using Stata

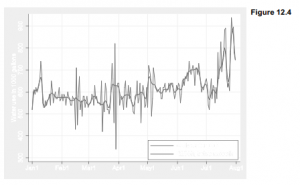
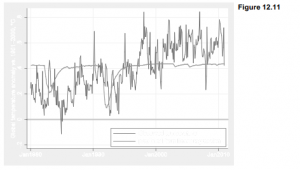
Earlier in this chapter we saw that an OLS regression of ncdctemp on four lagged predictors gave a good fit to observed temperature values (Figure 12.2), as well as physically plausible parameter estimates. A Durbin-Watson test found significant autocorrelation among the residuals, however, which undermines the OLS t and F tests. ARMAX (autoregressive moving

03
Oct
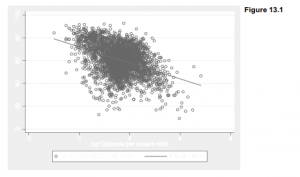
Regression with Random Intercepts by using Stata

To illustrate xtmixed, we begin with county-level data on votes in the 2004 presidential election (Robinson 2005). In this election, George W. Bush (receiving 50.7% of the popular vote) defeated John Kerry (48.3%) and Ralph Nader (0.4%). One striking aspect of this election was its geographical pattern: Kerry won states on the West coast,

03
Oct
Random Intercepts and Slopes by using Stata

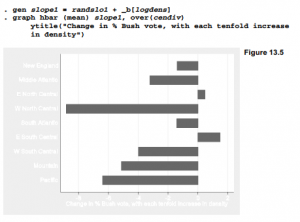
In Figure 13.2 we saw that, overall, the percentage of Bush votes tended to decline as population density increased. Our random-intercept model in the previous section accepted this generalization, while allowing intercepts to vary across regions. But what if the slope of the votes-density relationship also varies across regions? A quick look at scatterplots

03
Oct
  • 1
  • …
  • 187
  • 188
  • 189
  • 190
  • 191
  • 192
  • 193
  • …
  • 196
Theories of the firm
  • Systems TheorySystems Theory
  • Behavioral theory of the firmBehavioral theory of the firm
  • Political Theories and ConceptsPolitical Theories and Concepts
  • Social Science: meaning, nature and scopeSocial Science: meaning, nature and scope
  • Resource-based theoryResource-based theory
  • Definition of Theory of the FirmDefinition of Theory of the Firm
  • What is a Scientific Theory?What is a Scientific Theory?
  • Hyper-competition theoryHyper-competition theory

Methodology & Skills
  • Qualitative methods: what and why use them?Qualitative methods: what and why use them?
  • Create your professional WordPress website without codeCreate your professional WordPress website without code
  • Quantitative Research: Definition, Methods, Types and ExamplesQuantitative Research: Definition, Methods, Types and Examples
  • Learn Programming Languages (JavaScript, Python, Java, PHP, C, C#, C++, HTML, CSS)Learn Programming Languages (JavaScript, Python, Java, PHP, C, C#, C++, HTML, CSS)
  • Doing Management Research: A Comprehensive GuideDoing Management Research: A Comprehensive Guide
  • A Comparison of R, Python, SAS, SPSS and STATA for a Best Statistical SoftwareA Comparison of R, Python, SAS, SPSS and STATA for a Best Statistical Software
  • Research methodology: a step-by-step guide for beginnersResearch methodology: a step-by-step guide for beginners

Connecting and sharing with us

... by your free and real actions.

hotlineTComment and discuss your ideas

Enthusiastic to comment and discuss the articles, videos on our website by sharing your knowledge and experiences.

hỗ trợ hkt Respect the copyright

Updating and sharing our articles and videos with sources from our channel.

hỗ trợ hkt Subscribe and like our articles and videos

Supporting us mentally and with your free and real actions on our channel.

HKT Channel - Science Theories

About HKT CHANNEL
About HKT CONSULTANT

Website Structure

Corporate Management
Startup & Entrepreneurship
Management Science
Theories of the firm

HKT Consultant JSC.

      "Knowledge - Experience - Success"
- Email: Info@phantran.net
- Website:
phantran.net

  • Home
  • Corporate Management
    • Entrepreneurship
      • Startup
      • Entrepreneurship
      • Growth of firm
    • Managing primary activities
      • Marketing
      • Sales Management
      • Retail Management
      • Import – Export
      • International Business
      • E-commerce
      • Project Management
      • Production Management
      • Quality Management
      • Logistics Management
      • Supply Chain Management
    • Managing support activities
      • Strategy
      • Human Resource Management
      • Organizational Culture
      • Information System Management
      • Corporate Finance
      • Stock Market
      • Accounting
      • Office Management
  • Economics of Firm
    • Theory of the Firm
    • Management Science
    • Microeconomics
  • Research Methodology
    • Methodology
      • Research Process
      • Experimental Research
      • Research Philosophy
      • Management Research
      • Writing a thesis
      • Writing a paper
    • Qualitative Research
      • Literature Review
      • Interview
      • Case Study
      • Action Research
      • Qualitative Content Analysis
      • Observation
      • Phenomenology
    • Quantitative Research
      • Statistics and Econometrics
      • Questionnaire Survey
      • Quantitative Content Analysis
      • Meta Analysis
      • Statistical Software
        • STATA
        • SPSS
        • SEM-AMOS
        • SmartPLS
        • Eviews
  • About us