Skip to content
    • info@phantran.net
  • Connecting and sharing with us
  • -
  • About us
    • info@phantran.net
HKT ConsultantHKT Consultant
  • Home
  • Corporate Management
    • Entrepreneurship
      • Startup
      • Entrepreneurship
      • Growth of firm
    • Managing primary activities
      • Marketing
      • Sales Management
      • Retail Management
      • Import – Export
      • International Business
      • E-commerce
      • Project Management
      • Production Management
      • Quality Management
      • Logistics Management
      • Supply Chain Management
    • Managing support activities
      • Strategy
      • Human Resource Management
      • Organizational Culture
      • Information System Management
      • Corporate Finance
      • Stock Market
      • Accounting
      • Office Management
  • Economics of Firm
    • Theory of the Firm
    • Management Science
    • Microeconomics
  • Research Methodology
    • Methodology
      • Research Process
      • Experimental Research
      • Research Philosophy
      • Management Research
      • Writing a thesis
      • Writing a paper
    • Qualitative Research
      • Literature Review
      • Interview
      • Case Study
      • Action Research
      • Qualitative Content Analysis
      • Observation
      • Phenomenology
    • Quantitative Research
      • Statistics and Econometrics
      • Questionnaire Survey
      • Quantitative Content Analysis
      • Meta Analysis
      • Statistical Software
        • STATA
        • SPSS
        • SEM-AMOS
        • SmartPLS
        • Eviews
Using Frequency Weights with Stata

summarize, tabulate, table and related commands can be used with frequency weights that indicate the number of replicated observations. For example, here are the mean and other statistics for per capita electricity use across all U.S. states. This mean, 13,318 kWh, tells us the average electricity across the 51 states (including District of Columbia)

28
Sep
One-Sample Tests by using Stata

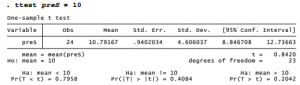
One-sample t tests have two seemingly different applications: Testing whether a sample mean y differs significantly from an hypothesized value p0 . Testing whether the means of yj and y2 , two variables measured over the same set of observations, differ significantly from each other. This is equivalent to testing whether the mean of

29
Sep
Two-Sample Tests by using Stata

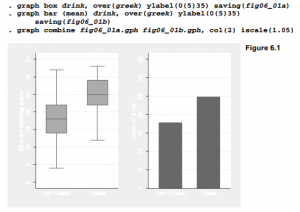
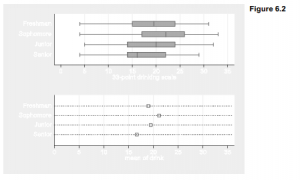
The remainder of this chapter draws examples from a survey of college undergraduates by Ward and Ault (1990). About 19% of these students belong to a fraternity or sorority. On campus, these organizations and their members are commonly referred to as “Greeks” not with any reference to nationality, but because most of the organizations

1 Comment

29
Sep
One-Way Analysis of Variance (ANOVA) by using Stata

Analysis of variance (ANOVA) provides another way, more general than t tests, to test for differences among means. The simplest case, one-way ANOVA, tests whether the means of y differ across categories of x. One-way ANOVA can be performed by a oneway command with the general form oneway measurement categorical. For example, The tabulate

29
Sep
Two- and N-Way Analysis of Variance by using Stata

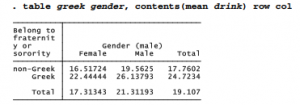
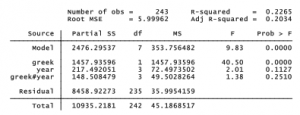
One-way ANOVA examines how the means of measurement variable y vary across categories of one other variable x. N-way ANOVA generalizes this approach to deal with two or more categorical x variables. For example, we might consider how drinking behavior varies not only by fraternity or sorority membership, but also by gender. We start

29
Sep
Factor Variables and Analysis of Covariance (ANCOVA) by using Stata

anova and many other Stata estimation commands allow independent variables specified in factor variable notation. The prefix i. written before the name of an independent variable tells Stata to include indicator (binary) variables for levels of a categorical variable, as if each category comprised its own dichotomous predictor. Categorical variables marked by the i.

29
Sep
Predicted Values and Error-Bar Charts by using Stata

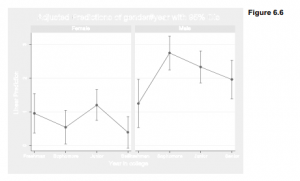
After anova , the followup command predict calculates predicted values, residuals or standard errors and diagnostic statistics. One use for such statistics is in drawing graphical representations of the model results, such as an error-bar chart. For a simple illustration, we return to the one­way ANOVA of drink by year: . anova drink year

29
Sep
Simple Regression by using Stata

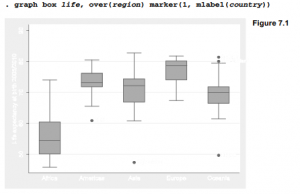
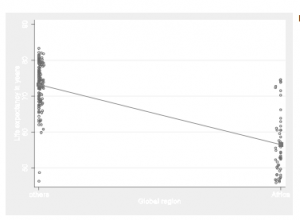
File Nations2.dta contains U.N. human-development indicators for 194 countries: . use C:\data\Nations2.dta, clear Life expectancies (life) exhibit much place-to-place variation. For example, Figure 7.1 shows that they tend to be lower in Africa than elsewhere. To what extent can variations in life expectancy be explained by average education, per capita wealth and other development

29
Sep
Correlation in Linear Regression by using Stata

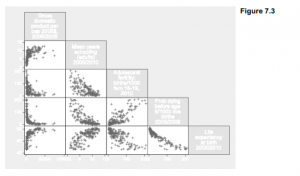
Ordinary least-squares (OLS) regression finds the best-fitting straight line. A Pearson product- moment correlation coefficient describes how well the best-fitting line fits. correlate obtains correlations for listed variables. . correlate gdp school adfert chldmort life correlate reports correlations based only on those observations that have non-missing values on all of the listed variables. From

29
Sep
Multiple Regression by using Stata

Simple regression and correlation establish that a country’s life expectancy is related to the mean years of schooling: school by itself explains about 52% of the variance of life. But might that relationship be spurious, occurring just because both schooling and life expectancy reflect a country’s economic wealth? Does schooling matter once we control

1 Comment

29
Sep
Hypothesis Tests with Linear Regression by using Stata

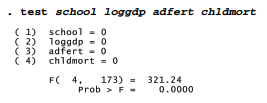
Two types ofhypothesis tests appear in regress output tables. As with other common hypothesis tests, they begin from the assumption that observations in the sample at hand were drawn randomly and independently from an infinitely large population. Overall F test: The F statistic at the upper right in the regression table evaluates the null

1 Comment

29
Sep
Dummy Variables in Linear Regression by using Stata

Categorical variables can become predictors in a regression when they are expressed as one or more {0,1} dichotomies called dummy variables. For example, we have already seen large regional differences in life expectancies (Figure 7.1). The categorical variable region takes values from 1 (Africa) to 5 (Oceania) which can be re-expressed as a set

29
Sep
Interaction Effects in Linear Regression by using Stata

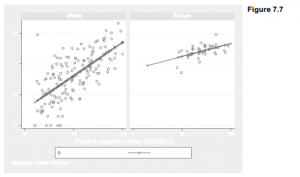
The previous section described what are called “intercept dummy variables,” because their coefficients amount to shifts in a regression equation’s y intercept, comparing the 0 and 1 groups. Another use for dummy variables is to form interaction terms called “slope dummy variables” by multiplying a dummy times a measurement variable. In this section we

29
Sep
Robust Estimates of Variance in Linear Regression by using Stata

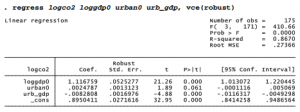
The standard errors and hypothesis tests that accompany ordinary regression (such as regress or anova) assume that errors follow independent and identical distributions. If this assumption is untrue, those standard errors probably will understate the true sample-to-sample variation, and yield unrealistically narrow confidence intervals or too-low test probabilities. To cope with a common problem

29
Sep
Predicted Values and Residuals in Linear Regression by using Stata

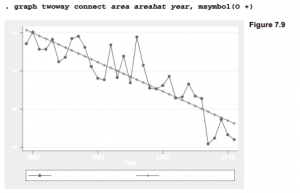
After any regression, the predict command can obtain not only predicted values, but also residuals and other post-estimation case statistics — statistics that have separate values for each observation in the data. Switching to a different example for this section, we will look at the simple regression of September Arctic sea ice area on

29
Sep
Other Case Statistics with Linear Regression by using Stata

predict can also calculate many other case statistics appropriate for the recently-fitted model. After regress (or anova), predict options include the following. Substitute any new variable name for new in these examples. . predict new   Predicted values of y. predict new, xb means the same thing (referring to Xb, the vector of predicted y

29
Sep
Diagnosing Multicollinearity and Heteroskedasticity in Linear Regression by using Stata

Multicollinearity refers to the problem of too-strong linear relationships among the predictors or independent variables in a model. If perfect multicollinearity exists among the predictors, regression equations lack unique solutions. Stata warns us and then drops one of the offending predictors. High but not perfect multicollinearity causes more subtle problems. When we add a

1 Comment

29
Sep
Confidence Bands in Simple Regression by using Stata

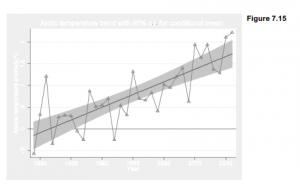
This section introduces some additional graphics that help to visualize a regression model or diagnose possible problems. Continuing with the Arctic9.dta data, variable tempN describes mean annual air temperature anomalies for the entire region from 64 to 90 degrees north latitude, estimated from land and sea surface records by NASA. Temperature anomalies represent differences,

29
Sep
Diagnostic Graphs with Linear Regression by using Stata
29/09/2022

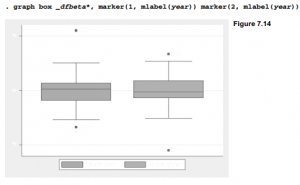
Stata offers many specialized graphs useful for diagnostic purposes following a regression. A few of these are illustrated in this section; type help regress postestimation for a list. Our example here will be an elaboration of the Arctic ice model, in which September sea ice area is predicted from year and year2 (after year

1 Comment

Lowess Smoothing by using Stata

Lowess smoothing, already demonstrated without explanation at several points in this book, is a very useful tool for nonparametric regression. Nonparametric regression methods generally do not yield an explicit regression equation, and do not require the analyst to specify a relationship’s functional form in advance. Instead, they help to explore the data with an

30
Sep
  • 1
  • …
  • 185
  • 186
  • 187
  • 188
  • 189
  • 190
  • 191
  • …
  • 196
Theories of the firm
  • Decision TheoryDecision Theory
  • Theory of Competitive AdvantageTheory of Competitive Advantage
  • Political Theories and ConceptsPolitical Theories and Concepts
  • Great Thinkers and their Big IdeasGreat Thinkers and their Big Ideas
  • Property Rights TheoryProperty Rights Theory
  • Resource dependence theoryResource dependence theory
  • The Invisible hand of Adam SmithThe Invisible hand of Adam Smith
  • Becoming and evolution of a scientific theoryBecoming and evolution of a scientific theory

Methodology & Skills
  • Learn Programming Languages (JavaScript, Python, Java, PHP, C, C#, C++, HTML, CSS)Learn Programming Languages (JavaScript, Python, Java, PHP, C, C#, C++, HTML, CSS)
  • Research methodology: a step-by-step guide for beginnersResearch methodology: a step-by-step guide for beginners
  • Quantitative Research: Definition, Methods, Types and ExamplesQuantitative Research: Definition, Methods, Types and Examples
  • Qualitative methods: what and why use them?Qualitative methods: what and why use them?
  • A Comparison of R, Python, SAS, SPSS and STATA for a Best Statistical SoftwareA Comparison of R, Python, SAS, SPSS and STATA for a Best Statistical Software
  • Create your professional WordPress website without codeCreate your professional WordPress website without code
  • Doing Management Research: A Comprehensive GuideDoing Management Research: A Comprehensive Guide

Connecting and sharing with us

... by your free and real actions.

hotlineTComment and discuss your ideas

Enthusiastic to comment and discuss the articles, videos on our website by sharing your knowledge and experiences.

hỗ trợ hkt Respect the copyright

Updating and sharing our articles and videos with sources from our channel.

hỗ trợ hkt Subscribe and like our articles and videos

Supporting us mentally and with your free and real actions on our channel.

HKT Channel - Science Theories

About HKT CHANNEL
About HKT CONSULTANT

Website Structure

Corporate Management
Startup & Entrepreneurship
Management Science
Theories of the firm

HKT Consultant JSC.

      "Knowledge - Experience - Success"
- Email: Info@phantran.net
- Website:
phantran.net

  • Home
  • Corporate Management
    • Entrepreneurship
      • Startup
      • Entrepreneurship
      • Growth of firm
    • Managing primary activities
      • Marketing
      • Sales Management
      • Retail Management
      • Import – Export
      • International Business
      • E-commerce
      • Project Management
      • Production Management
      • Quality Management
      • Logistics Management
      • Supply Chain Management
    • Managing support activities
      • Strategy
      • Human Resource Management
      • Organizational Culture
      • Information System Management
      • Corporate Finance
      • Stock Market
      • Accounting
      • Office Management
  • Economics of Firm
    • Theory of the Firm
    • Management Science
    • Microeconomics
  • Research Methodology
    • Methodology
      • Research Process
      • Experimental Research
      • Research Philosophy
      • Management Research
      • Writing a thesis
      • Writing a paper
    • Qualitative Research
      • Literature Review
      • Interview
      • Case Study
      • Action Research
      • Qualitative Content Analysis
      • Observation
      • Phenomenology
    • Quantitative Research
      • Statistics and Econometrics
      • Questionnaire Survey
      • Quantitative Content Analysis
      • Meta Analysis
      • Statistical Software
        • STATA
        • SPSS
        • SEM-AMOS
        • SmartPLS
        • Eviews
  • About us