Skip to content
    • info@phantran.net
  • Connecting and sharing with us
  • -
  • About us
    • info@phantran.net
HKT ConsultantHKT Consultant
  • Home
  • Corporate Management
    • Entrepreneurship
      • Startup
      • Entrepreneurship
      • Growth of firm
    • Managing primary activities
      • Marketing
      • Sales Management
      • Retail Management
      • Import – Export
      • International Business
      • E-commerce
      • Project Management
      • Production Management
      • Quality Management
      • Logistics Management
      • Supply Chain Management
    • Managing support activities
      • Strategy
      • Human Resource Management
      • Organizational Culture
      • Information System Management
      • Corporate Finance
      • Stock Market
      • Accounting
      • Office Management
  • Economics of Firm
    • Theory of the Firm
    • Management Science
    • Microeconomics
  • Research Methodology
    • Methodology
      • Research Process
      • Experimental Research
      • Research Philosophy
      • Management Research
      • Writing a thesis
      • Writing a paper
    • Qualitative Research
      • Literature Review
      • Interview
      • Case Study
      • Action Research
      • Qualitative Content Analysis
      • Observation
      • Phenomenology
    • Quantitative Research
      • Statistics and Econometrics
      • Questionnaire Survey
      • Quantitative Content Analysis
      • Meta Analysis
      • Statistical Software
        • STATA
        • SPSS
        • SEM-AMOS
        • SmartPLS
        • Eviews
Robust Regression by using Stata

Stata’s basic regress and anova commands perform ordinary least squares (OLS) regression. The popularity of OLS derives in part from its theoretical advantages given ideal data. If errors are normally, independently and identically distributed (normal i.i.d.), then OLS is more efficient than any other unbiased estimator. The flip side of this statement often gets

30
Sep
Further rreg and qreg Applications by using Stata

The previous section showed basic applications of rreg and qreg. These commands also can be used in many other ways, from simple to complex. For example, to obtain a 90% confidence interval for the mean of a single variable such as Antarctic air temperature (tempS), we could type the usual confidence-interval command ci: Alternatively,

30
Sep
Nonlinear Regression — part 1

Variable transformations allow fitting some curvilinear relationships using the familiar techniques of intrinsically linear models. Intrinsically nonlinear models, on the other hand, require a different class of fitting techniques. The nl command performs nonlinear regression by iterative least squares. This section illustrates with the artificial examples in nonlin.dta: The nonlin.dta data are manufactured, with

30
Sep
Nonlinear Regression — part 2

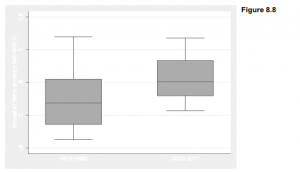
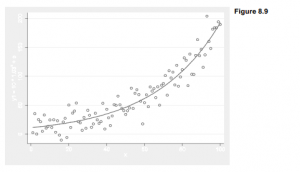
September ice in the Arctic (Arctic9.dta) provides a real-world example. Previously we saw that sea ice area declined over 1979-2011, the period of close satellite observation. Diagnostic graphs reveal that a linear model fits poorly, however, because the decline has been faster than linear (Figures 7.9, 7.11). An alternative quadratic model better describes the

30
Sep
Box–Cox Regression by using Stata

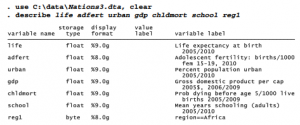
Leaving colder regions behind, the remainder of this chapter works with the United Nations human development data in Nations3.dta. Nonlinear relationships among variables are prominent in scatterplots of these data, such as that in Figure 7.4. Logarithms and other transformations from Tukey’s ladder of powers (Chapter 5) provide simple tools for making nonlinear relationships

30
Sep
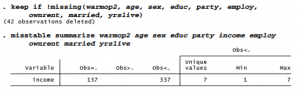
Multiple Imputation of Missing Values in Stata

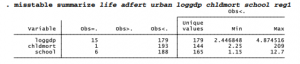
Nations3.dta contains information about 194 countries, but missing values restrict our analysis in previous sections to a subset of 178 that have complete information on all variables of interest. This listwise deletion approach of setting aside incomplete observations is, out of necessity, a common statistical practice. Its known drawbacks include loss of observations and

30
Sep
Structural Equation Modeling by using Stata

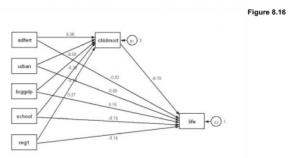
The regression models above treat adolescent fertility, percent urban and other national characteristics as possible predictors of life expectancy, without necessarily asserting that they are its causes. One of those predictors, child mortality rate, has an obvious causal connection with life expectancy. But child mortality rates in turn are influenced by other national characteristics

30
Sep
Space Shuttle Data in Stata

Our first example for this chapter, shuttle.dta, involves historical data covering the first 25 flights of the U.S. space shuttle. These data contain evidence that, if properly analyzed, might have persuaded NASA officials not to launch Challenger on its fatal flight in 1985 (the 25th shuttle flight, designated STS 51-L). The data are drawn

1 Comment

30
Sep
Using Logistic Regression with Stata

Here is the same regression seen earlier, but using logistic instead of logit: . logistic any date Note the identical log likelihoods and %2 statistics. Instead of coefficients (b), logistic displays odds ratios (eb ). The numbers in the Odds Ratio column of the logistic output are amounts by which the odds favoring y

1 Comment

30
Sep
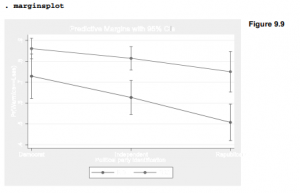
Marginal or Conditional Effects Plots by using Stata

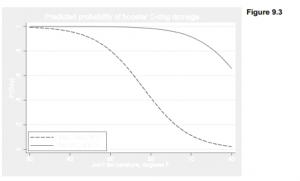
Plotting the adjusted marginal or conditional effects helps to understand and communicate what a logistic model implies about probabilities. For example, we could find the predicted probability of any thermal distress incidents as a function of temp, holding date constant at relatively low (early) and high (late) values. Elapsed dates in these data range

30
Sep
Diagnostic Statistics and Plots by using Stata

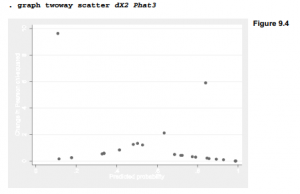
As mentioned earlier, the logistic regression influence and diagnostic statistics obtained by predict refer not to individual observations, as do the OLS regression diagnostics of Chapter 7. Rather, logistic diagnostics refer to x patterns. In the space shuttle data, however, each x pattern is unique — no two flights share the same combination of

30
Sep
Logistic Regression with Ordered-Category y by using Stata

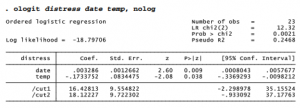
logit and logistic fit models for variables with two outcomes, coded 0 and 1. We need other methods for models in whichy takes on more than two values. Two important possibilities are ordered and multinomial logistic regression. ologit   Ordered logistic regression, where y is an ordinal (ordered-category) variable. The numeric values representing the categories

30
Sep
Multinomial Logistic Regression by using Stata

When the dependent variable’s categories are not ordinal, multinomial logit regression (also called polytomous logit regression) provides appropriate tools. If y has only two categories, mlogit (and ologit) both fit the same model as logistic. Otherwise, though, an mlogit model is more complex. Multiple-category dependent variables occur often in survey data. The Granite State

30
Sep
Multiple Imputation of Missing Values – Logit Regression by using Stata

Chapter 8 introduced Stata’s methods for multiple imputation of missing values, illustrated by a regression example. Multiple-imputation methods work with other types of analysis as well, including the logit-type models discussed in this chapter. For an illustration, we return to the Granite State Poll data and the climate-change belief indicator warmop2. The previous section

1 Comment

30
Sep
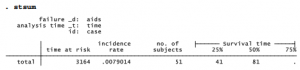
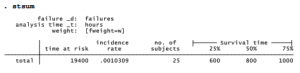
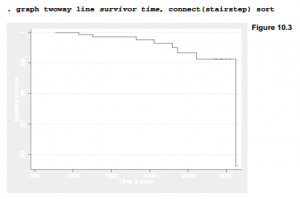
Survival-Time Data in Stata

Survival-time data contain, at a minimum, one variable measuring how much time elapsed before a certain event occurred for each observation. The literature often terms this event of interest a “failure,” regardless of its real-world meaning. When failure has not occurred to an observation by the time data collection ends, that observation is said

1 Comment

30
Sep
Count-Time Data with Stata

Survival-time (st) datasets like aids.dta contain information on individual people or things, with variables indicating the time at which failure or censoring occurred for each individual. A different type of dataset called count-time (ct) contains aggregate data, with variables counting the number of individuals that failed or were censored at time t. For example,

30
Sep
Kaplan–Meier Survivor Functions by using Stata

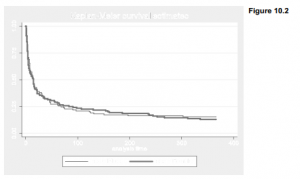
Let n t represent the number of observations that have not failed, and are not censored, at the beginning of time period t. dt represents the number of failures that occur to these observations during time period t. The Kaplan-Meier estimator of surviving beyond time t is the product of survival probabilities in t

30
Sep
Cox Proportional Hazard Models by using Stata

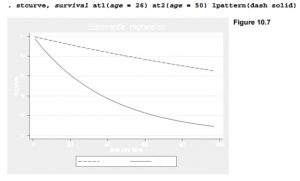
Regression methods allow us to take survival analysis further and examine the effects of multiple continuous or categorical predictors. One widely-used method known as Cox regression employs a proportional hazard model. The hazard rate for failure at time t is defined as the rate of failures at time t among those who have survived

1 Comment

01
Oct
Exponential and Weibull Regression by using Stata

Cox regression estimates the baseline survivor function empirically without reference to any theoretical distribution. Several alternative parametric approaches begin instead from assumptions that survival times do follow a known theoretical distribution. Possible distribution families include the exponential, Weibull, lognormal, log-logistic, Gompertz or generalized gamma. Models based on any of these can be fit through

01
Oct
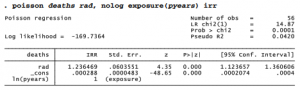
Poisson Regression by using Stata

If events occur independently and with constant rate, then counts of events over a given period of time follow a Poisson distribution. Let r j represent the incidence rate: The denominator in [10.4] is termed the “exposure” and is often measured in units such as person-years. We model the logarithm of incidence rate as

01
Oct
  • 1
  • …
  • 186
  • 187
  • 188
  • 189
  • 190
  • 191
  • 192
  • …
  • 196
Theories of the firm
  • Property Rights TheoryProperty Rights Theory
  • Theory of the Visible HandTheory of the Visible Hand
  • Evolutionary Theory of the FirmEvolutionary Theory of the Firm
  • List of Art movementsList of Art movements
  • What is a Scientific Theory?What is a Scientific Theory?
  • Contingency TheoryContingency Theory
  • Decision TheoryDecision Theory
  • Economic Theories and ConceptsEconomic Theories and Concepts

Methodology & Skills
  • Learn Programming Languages (JavaScript, Python, Java, PHP, C, C#, C++, HTML, CSS)Learn Programming Languages (JavaScript, Python, Java, PHP, C, C#, C++, HTML, CSS)
  • Quantitative Research: Definition, Methods, Types and ExamplesQuantitative Research: Definition, Methods, Types and Examples
  • Create your professional WordPress website without codeCreate your professional WordPress website without code
  • Doing Management Research: A Comprehensive GuideDoing Management Research: A Comprehensive Guide
  • A Comparison of R, Python, SAS, SPSS and STATA for a Best Statistical SoftwareA Comparison of R, Python, SAS, SPSS and STATA for a Best Statistical Software
  • Research methodology: a step-by-step guide for beginnersResearch methodology: a step-by-step guide for beginners
  • Qualitative methods: what and why use them?Qualitative methods: what and why use them?

Connecting and sharing with us

... by your free and real actions.

hotlineTComment and discuss your ideas

Enthusiastic to comment and discuss the articles, videos on our website by sharing your knowledge and experiences.

hỗ trợ hkt Respect the copyright

Updating and sharing our articles and videos with sources from our channel.

hỗ trợ hkt Subscribe and like our articles and videos

Supporting us mentally and with your free and real actions on our channel.

HKT Channel - Science Theories

About HKT CHANNEL
About HKT CONSULTANT

Website Structure

Corporate Management
Startup & Entrepreneurship
Management Science
Theories of the firm

HKT Consultant JSC.

      "Knowledge - Experience - Success"
- Email: Info@phantran.net
- Website:
phantran.net

  • Home
  • Corporate Management
    • Entrepreneurship
      • Startup
      • Entrepreneurship
      • Growth of firm
    • Managing primary activities
      • Marketing
      • Sales Management
      • Retail Management
      • Import – Export
      • International Business
      • E-commerce
      • Project Management
      • Production Management
      • Quality Management
      • Logistics Management
      • Supply Chain Management
    • Managing support activities
      • Strategy
      • Human Resource Management
      • Organizational Culture
      • Information System Management
      • Corporate Finance
      • Stock Market
      • Accounting
      • Office Management
  • Economics of Firm
    • Theory of the Firm
    • Management Science
    • Microeconomics
  • Research Methodology
    • Methodology
      • Research Process
      • Experimental Research
      • Research Philosophy
      • Management Research
      • Writing a thesis
      • Writing a paper
    • Qualitative Research
      • Literature Review
      • Interview
      • Case Study
      • Action Research
      • Qualitative Content Analysis
      • Observation
      • Phenomenology
    • Quantitative Research
      • Statistics and Econometrics
      • Questionnaire Survey
      • Quantitative Content Analysis
      • Meta Analysis
      • Statistical Software
        • STATA
        • SPSS
        • SEM-AMOS
        • SmartPLS
        • Eviews
  • About us