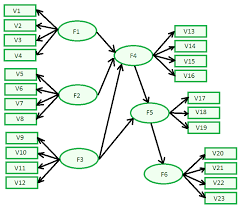
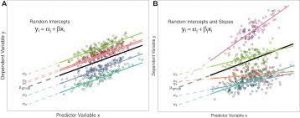
Mixed-Effects Models
Mixed-effects models, sometimes called conditionally random models, combine the (fixed-effects) moderator analyses of Chapter 9 with the estimation of variance in population effect sizes (random-effects) described earlier in this chapter. These models are useful when you want to evaluate moderators in meta-analysis, and you (1) either want the generalizability provided by random-effects models, or