Skip to content
    • info@phantran.net
  • Connecting and sharing with us
  • -
  • About us
    • info@phantran.net
HKT ConsultantHKT Consultant
  • Home
  • Corporate Management
    • Entrepreneurship
      • Startup
      • Entrepreneurship
      • Growth of firm
    • Managing primary activities
      • Marketing
      • Sales Management
      • Retail Management
      • Import – Export
      • International Business
      • E-commerce
      • Project Management
      • Production Management
      • Quality Management
      • Logistics Management
      • Supply Chain Management
    • Managing support activities
      • Strategy
      • Human Resource Management
      • Organizational Culture
      • Information System Management
      • Corporate Finance
      • Stock Market
      • Accounting
      • Office Management
  • Economics of Firm
    • Theory of the Firm
    • Management Science
    • Microeconomics
  • Research Methodology
    • Methodology
      • Research Process
      • Experimental Research
      • Research Philosophy
      • Management Research
      • Writing a thesis
      • Writing a paper
    • Qualitative Research
      • Literature Review
      • Interview
      • Case Study
      • Action Research
      • Qualitative Content Analysis
      • Observation
      • Phenomenology
    • Quantitative Research
      • Statistics and Econometrics
      • Questionnaire Survey
      • Quantitative Content Analysis
      • Meta Analysis
      • Statistical Software
        • STATA
        • SPSS
        • SEM-AMOS
        • SmartPLS
        • Eviews
Line Plots and Connected-Line Plots by using Stata

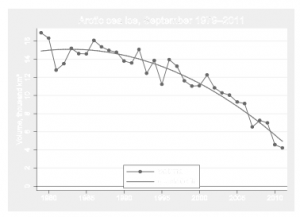
Mechanically, connected-line plots (graph twoway connect) are just scatterplots in which the points are connected by line segments. Line plots (graph twoway line) show the line segments without markers for the scatterplot points. Both belong to Stata’s versatile graph twoway family, which can be overlaid in any combinations. The scatterplot options that control axis

28
Sep
Other Twoway Plot Types by using Stata

In addition to basic line plots and scatterplots, the graph twoway command can draw a wide variety of other types. This section illustrates several more; type help graph twoway for a complete list. Earlier, in Figures 3.10 and 3.11, we used graph twoway lfit (linear fit) to draw a simple regression line. A similar

28
Sep
Bar Charts and Pie Charts by using Stata

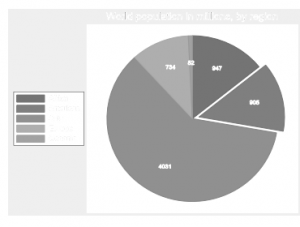
The graph bar command, unlike graph twoway bar, works well to display relationships involving one or more categorical variables. Such graphs prove particularly useful with survey data, as will be shown in Chapter 4. This section serves just to introduce the command, with an example using variables from the cross-national dataset Nations_2.dta. . use

28
Sep
Symmetry and Quantile Plots by using Stata

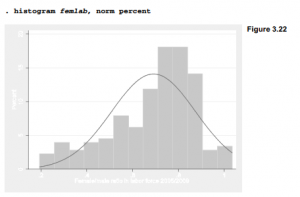
Box plots, bar charts and histograms summarize measurement variable distributions, hiding individual data points to clarify overall patterns. Symmetry and quantile plots, on the other hand, include points for every observation. They take more effort to read than summary graphs, because they convey more detailed information. A histogram of the ratio of females to

28
Sep
Adding Text to Graphs by using Stata

Titles, captions and notes can be added to make graphs more self-explanatory. The default versions of titles and subtitles appear above the data region; notes (which might document the data source, for instance) and captions appear below. See Figure 3.7 for an example using title, caption and note. These defaults can be overridden, of

28
Sep
Graphing with Do-Files by using Stata

Complicated graphics like Figure 3.26 require graph commands that are many physical lines long (although Stata views the whole command as one logical line). Do-files, introduced in Chapter 2, help in writing such multi-line commands. They also make it easy to save the command for future re-use, in case we later want to modify

28
Sep
Retrieving and Combining Graphs by using Stata

Any graph saved in Stata’s “live” .gph format can subsequently be retrieved into memory by the graph use command. For example, we could retrieve Figure 3.26 by typing . graph use fig03_26.gph Once the graph is in memory, it is displayed onscreen and can be printed or saved again with a different name or

1 Comment

28
Sep
Graph Editor in Stata

The Graph Editor allows us to alter the appearance of a graph currently in memory, whether just drawn or previously saved and retrieved by graph use. It is easier to learn about this useful feature by experimenting yourself, rather than reading from a book. As an example to get started, however, we can show

28
Sep
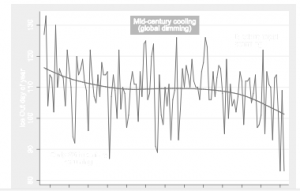
Creative Graphing by using Stata

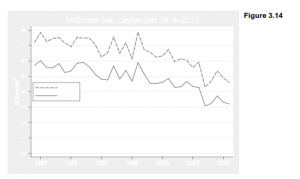
Edward Tufte, in his elegant and influential books about graphing data (1990, 1997, 2001, 2006), calls for more effort at designing clear, information-packed graphics. Presenting a rich collection of impressively good or humorously awful examples, Tufte shows how successful graphics allow viewers to draw their own comparisons and examine details of relationships between variables.

28
Sep
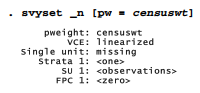
Declare Survey Data in Stata

Since 2001, the Granite State Poll at the University of New Hampshire has conducted statewide telephone surveys several times each year. Each survey contacts a new sample of about 500 people, asking a variety of opinion questions along with respondent background characteristics. The poll’s political findings attain national importance every four years during New

28
Sep
Design Weights of Survey Data in Stata

The previous section took weight definitions for granted, and indeed many data users begin with a completed survey in which weights have already been calculated by someone else. This and the following sections present examples showing how such calculations are done. Survey researchers apply probability weights to adjust for biases in their sampling methods.

28
Sep
Poststratification Weights of Survey Data in Stata

The previous section gave an example of weights based on the sampling design, which was known before data collection began. A second type of weights might be defined after we have collected the data, and see that despite our best efforts, it appears unrepresentative in some respect. For instance, the sample might have a

1 Comment

28
Sep
Survey-Weighted Tables and Graphs by using Stata

The June 2011 Granite State Poll included six questions related to global warming or climate change. Several questions were factual, but one (warmop) asked what you personally believe. Which of the following three statements do you personally believe? Climate change is happening now, caused mainly by human activities. Climate change is happening now, but

28
Sep
Bar Charts for Multiple Comparisons by using Stata

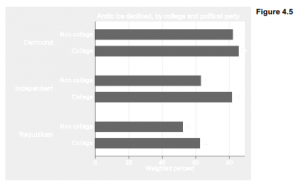
The catplot bar charts in Figure 4.3 depict a relationship between two categorical variables, each with four categories. If we have more than two variables, or more than a few categories, however, the catplot approach becomes cluttered. A cleaner alternative for making multiple comparisons of categorical variables employs Stata’s horizontal bar chart command hbar.

1 Comment

28
Sep
Summary Statistics for Measurement Variables by using Stata

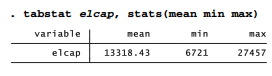
Dataset electricity.dta contains information on electricity consumption in U.S. states, from the California Energy Commission (2012). To find the mean and standard deviation of per capita electricity use (elcap), type This table also gives the number of nonmissing observations and the variable’s minimum and maximum values. If we had simply typed summarize with no

28
Sep
Exploratory Data Analysis by using Stata

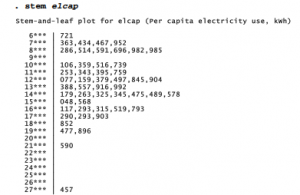
Statistician John Tukey assembled a toolkit of old and new methods for exploratory data analysis (EDA), which involves analyzing data in an exploratory and skeptical way without making unneeded assumptions (see Tukey 1977; also Hoaglin, Mosteller and Tukey 1983, 1985). Box plots, introduced in Chapter 3, are one the most popular EDA methods. Another

28
Sep
Normality Tests and Transformations by using Stata

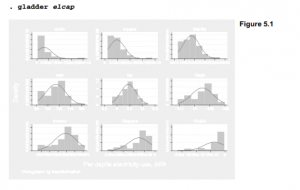
Many statistical procedures work best when applied to variables that follow normal distributions. The preceding section described exploratory methods to check for approximate normality, extending the graphical tools (histograms, box plots, symmetry plots and quantile-normal plots) presented in Chapter 3. A skewness-kurtosis test, making use of the skewness and kurtosis statistics shown by summarize,

28
Sep
Frequency Tables and Two-Way Cross-Tabulations by using Stata

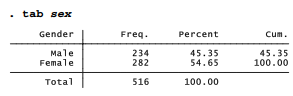
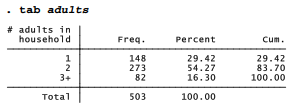
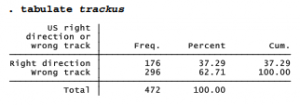
The summary statistics, graphs and transformations described above apply mainly to measurement variables. Categorical variables require different approaches, often starting with simple one- or two-way tables. For examples using such tables we return to the Granite State Poll data, Granite2011_6.dta. One question (trackus) asked whether people think the U.S. is headed in the right

1 Comment

28
Sep
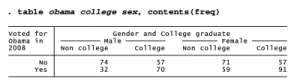
Multiple Tables and Multi-Way Cross-Tabulations by using Stata

With surveys and other large datasets, we sometimes need frequency distributions of many different variables. Instead of asking for each table separately, for example by typing tabulate tparty, then tabulate obama, and finally tabulate trackus, we could simply use another specialized command, tabl: . tabl tparty obama trackus Or, to produce one-way frequency tables

28
Sep
Tables of Means, Medians and Other Summary Statistics by using Stata

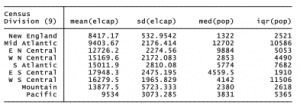
Summary Statistics tabulate produces tables of means and standard deviations within categories of the tabulated variable. For the remaining examples in this chapter, we return to the data on electricity consumption in U.S. states. tabulate gives us one way to view summary statistics of per capita electricity consumption (elcap) for each of the 9

28
Sep
  • 1
  • …
  • 184
  • 185
  • 186
  • 187
  • 188
  • 189
  • 190
  • …
  • 196
Theories of the firm
  • Economic Theories and ConceptsEconomic Theories and Concepts
  • List of Art movementsList of Art movements
  • Great Thinkers and their Big IdeasGreat Thinkers and their Big Ideas
  • Theory of Competitive AdvantageTheory of Competitive Advantage
  • Nature and scope of scienceNature and scope of science
  • The Invisible hand of Adam SmithThe Invisible hand of Adam Smith
  • Behavioral theory of the firmBehavioral theory of the firm
  • Political Theories and ConceptsPolitical Theories and Concepts

Methodology & Skills
  • Create your professional WordPress website without codeCreate your professional WordPress website without code
  • Learn Programming Languages (JavaScript, Python, Java, PHP, C, C#, C++, HTML, CSS)Learn Programming Languages (JavaScript, Python, Java, PHP, C, C#, C++, HTML, CSS)
  • Qualitative methods: what and why use them?Qualitative methods: what and why use them?
  • A Comparison of R, Python, SAS, SPSS and STATA for a Best Statistical SoftwareA Comparison of R, Python, SAS, SPSS and STATA for a Best Statistical Software
  • Research methodology: a step-by-step guide for beginnersResearch methodology: a step-by-step guide for beginners
  • Quantitative Research: Definition, Methods, Types and ExamplesQuantitative Research: Definition, Methods, Types and Examples
  • Doing Management Research: A Comprehensive GuideDoing Management Research: A Comprehensive Guide

Connecting and sharing with us

... by your free and real actions.

hotlineTComment and discuss your ideas

Enthusiastic to comment and discuss the articles, videos on our website by sharing your knowledge and experiences.

hỗ trợ hkt Respect the copyright

Updating and sharing our articles and videos with sources from our channel.

hỗ trợ hkt Subscribe and like our articles and videos

Supporting us mentally and with your free and real actions on our channel.

HKT Channel - Science Theories

About HKT CHANNEL
About HKT CONSULTANT

Website Structure

Corporate Management
Startup & Entrepreneurship
Management Science
Theories of the firm

HKT Consultant JSC.

      "Knowledge - Experience - Success"
- Email: Info@phantran.net
- Website:
phantran.net

  • Home
  • Corporate Management
    • Entrepreneurship
      • Startup
      • Entrepreneurship
      • Growth of firm
    • Managing primary activities
      • Marketing
      • Sales Management
      • Retail Management
      • Import – Export
      • International Business
      • E-commerce
      • Project Management
      • Production Management
      • Quality Management
      • Logistics Management
      • Supply Chain Management
    • Managing support activities
      • Strategy
      • Human Resource Management
      • Organizational Culture
      • Information System Management
      • Corporate Finance
      • Stock Market
      • Accounting
      • Office Management
  • Economics of Firm
    • Theory of the Firm
    • Management Science
    • Microeconomics
  • Research Methodology
    • Methodology
      • Research Process
      • Experimental Research
      • Research Philosophy
      • Management Research
      • Writing a thesis
      • Writing a paper
    • Qualitative Research
      • Literature Review
      • Interview
      • Case Study
      • Action Research
      • Qualitative Content Analysis
      • Observation
      • Phenomenology
    • Quantitative Research
      • Statistics and Econometrics
      • Questionnaire Survey
      • Quantitative Content Analysis
      • Meta Analysis
      • Statistical Software
        • STATA
        • SPSS
        • SEM-AMOS
        • SmartPLS
        • Eviews
  • About us