Skip to content
    • info@phantran.net
  • Connecting and sharing with us
  • -
  • About us
    • info@phantran.net
HKT ConsultantHKT Consultant
  • Home
  • Corporate Management
    • Entrepreneurship
      • Startup
      • Entrepreneurship
      • Growth of firm
    • Managing primary activities
      • Marketing
      • Sales Management
      • Retail Management
      • Import – Export
      • International Business
      • E-commerce
      • Project Management
      • Production Management
      • Quality Management
      • Logistics Management
      • Supply Chain Management
    • Managing support activities
      • Strategy
      • Human Resource Management
      • Organizational Culture
      • Information System Management
      • Corporate Finance
      • Stock Market
      • Accounting
      • Office Management
  • Economics of Firm
    • Theory of the Firm
    • Management Science
    • Microeconomics
  • Research Methodology
    • Methodology
      • Research Process
      • Experimental Research
      • Research Philosophy
      • Management Research
      • Writing a thesis
      • Writing a paper
    • Qualitative Research
      • Literature Review
      • Interview
      • Case Study
      • Action Research
      • Qualitative Content Analysis
      • Observation
      • Phenomenology
    • Quantitative Research
      • Statistics and Econometrics
      • Questionnaire Survey
      • Quantitative Content Analysis
      • Meta Analysis
      • Statistical Software
        • STATA
        • SPSS
        • SEM-AMOS
        • SmartPLS
        • Eviews
Problem 10.3: Mixed ANOVA with SPSS

You can test null hypotheses about the effects of both between-groups factors and within-subjects factors with a Mixed ANOVA using the General Linear Model procedure. You can investigate interactions between factors as well as the effects of individual factors on a dependent variable. Repeat Problem 10.1 except add gender to see if there are

19
Sep
Problem 11.1: GLM Single-Factor Multivariate Analysis of Variance with SPSS

Sometimes you have more than one dependent variable that you want to analyze simultaneously. The GLM multivariate procedure allows you to analyze differences between levels of one or more (usually nominal level) independent variables, with respect to a linear combination of several dependent variables. One can also include normally distributed variables (covariates) as predictors

20
Sep
Problem 11.2: GLM Two-Factor Multivariate Analysis of Variance with SPSS

MANOVA is also useful when there is more than one independent variable and several related dependent variables. Let’s answer the following questions: Do students who differ in math grades and gender differ on a linear combination of two dependent variables (math achievement and visualization test)? Do males and females differ in terms of whether

20
Sep
Problem 11.3: Mixed MANOVA with SPSS

There might be times when you want to find out if there are differences between groups as well as within subjects; this can be answered with Mixed MANOVA. We have created a new dataset to use for this problem (MixedMANOVAdata). Retrieve MixedMANOVAdata.sav. Let’s answer the following question: Is there a difference between participants in

20
Sep
Problem 12.1: Unconditional Level 1 Repeated-Measures Model with SPSS

Although one can use GLM to compute analyses of repeated-measures data, as shown in Chapter 10, multilevel models often are more useful for analyzing repeated-measures data for several reasons. First, it is possible to use multilevel models even if there is some incomplete information on some participants or if their data are from different

20
Sep
Problem 12.2: Repeated Measures with Level 2 Predictor with SPSS

Now that we have determined that there is significant variance to explain, we will test another model with a Level 2 predictor, gender. This analysis will enable us to answer the following question: Does knowing a person’s gender help us in understanding his or her growth from age 8 to age 14, as measured

20
Sep
Problem 12.3: Unconditional Individuals-Nested-in-Schools Model with SPSS

For this problem, you will need to retrieve a new data set, HSB12.sav (not HSBdataNew.sav or any of the other datasets). This data set was downloaded from http://www.ats.ucla.edu/stat/paperexamples/singer/ with permission of Professor Judith D. Singer, and it was also analyzed in Raudenbush & Bryk (2002) and Singer (1998). It involves much of the same

1 Comments

20
Sep
Problem 12.4: Conditional Individuals-Nested-in-Schools Model with Level 1 Covariate with SPSS

In Problem 12.4, we could have looked at meanses, which is a variable at the school level (Level 2) and is the average socioeconomic class for the students in a particular school. As part of this problem, we will show you how you might have calculated meanses if it were not already available. However,

1 Comments

20
Sep
Randomness of Missing Data with SPSS

Are data missing completely at random (MCAR)? If data are MCAR, then whether or not a value is missing (missingness) is not related systematically to the values of that variable or any other variables (see Little & Rubin, 2002). If such a condition holds, then the only problem created by missing data is reduction

20
Sep
Problem 13.1: Patterns of the Missing Data with SPSS

In this problem, we will examine the missing data to see if they appear to be MAR and to see if multiple imputation seems advisable. 13.1. What are the patterns of missing values of weight, binge, mood, and preo? Is multiple imputation advisable for any of these variables? If so, which ones? Click on

1 Comments

20
Sep
Problem 13.2: Restructuring and Imputing the Data with SPSS

Next, we will conduct the actual imputations, but first, we need to restructure the dataset so that we can use the information about time to predict missingness (given what we found before about patterns 15 and 16 in which some participants stopped participating after time 2 or 3. Click on Date→Restructure. In the Restructure

1 Comments

20
Sep
Problem 13.3: Mixed Models Analysis after Imputed Data with SPSS

We will now conduct a mixed model analysis on the imputed data. This analysis is appropriate because our data involve repeated measures that are arrayed as multiple lines for each participant. The Mixed Models procedure is one that is set up in SPSS to readily read and use imputation datasets. We have discussed this

20
Sep
What Is Structural Equation Modeling?

Structural equation modeling (SEM) is a statistical methodology that takes a confirmatory (i.e., hypothesis-testing) approach to the analysis of a structural theory bearing on some phenomenon. Typically, this theory rep­resents “causal” processes that generate observations on multiple varia­bles (Bentler, 1988). The term “structural equation modeling” conveys two important aspects of the procedure: (a) that

2 Comments

20
Sep
Basic Concepts of Structural Equation Modeling

1. Latent versus Observed Variables In the behavioral sciences, researchers are often interested in studying theoretical constructs that cannot be observed directly. These abstract phe­nomena are termed latent variables, or factors. Examples of latent variables in psychology are self-concept and motivation; in sociology, powerless­ness and anomie; in education, verbal ability and teacher expectancy; in

20
Sep
The General Structural Equation Model

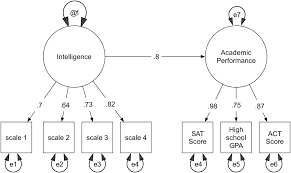
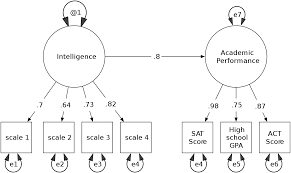
1. Symbol Notation Structural equation models are schematically portrayed using particular configurations of four geometric symbols—a circle (or ellipse), a square (or rectangle), a single-headed arrow, and a double-headed arrow. By conven­tion, circles (or ellipses; CD) represent unobserved latent factors, squares (or rectangles; ) represent observed variables, single-headed arrows (→) represent the impact of

1 Comments

20
Sep
Using the Amos Program

1. Key Concepts Building SEM models using Amos Graphics Building SEM models using Amos Tables View Corollary associated with single variable estimation Concept of model (or statistical) identification Computing the number of degrees of freedom Distinctions between first- and second-order CFA models Changing Amos default color for constructed models The program name, Amos, is

1 Comments

20
Sep
Application 1: Testing the Factorial Validity of a Theoretical Construct (First-Order CFA Model) with AMO

1. Key Concepts Hypothesized models conceptualized within a matrix format Error/uniqueness parameters Congeneric measures Working with model-refining tools in Amos Graphics Specification of data in Amos Graphics Calculation of estimates in Amos Graphics Selection of textual versus graphical output in Amos Graphics Evaluation of parameter estimates Evaluation of model as a whole model-fitting process

2 Comments

20
Sep
Application 2: Testing the Factorial Validity of Scores from a Measurement Scale (First-Order CFA Model) with AMOS

1. Key Concepts Assumption of multivariate normality The issue of multivariate outliers The issue of multivariate kurtosis Statistical strategies in addressing nonnormality SEM robust statistics Post hoc model testing and related issues Nested models and the chi-square difference test Error covariances and related issues 2. Modeling with Amos Graphics For our second application, we

1 Comments

20
Sep
Application 3: Testing the Factorial Validity of Scores from a Measurement Scale (Second-Order CFA Model) with AMOS

1. Key Concepts Model identification issue in higher-order models Determination of critical ratio differences Specification of equality constraints Likert scale scores analyzed as continuous versus categorical data Bayesian approach to analyses of categorical data Specification and interpretation of diagnostic plots In contrast to the two previous applications that focused on CFA first-order models, the

1 Comments

21
Sep
Application 4: Testing the Validity of a Causal Structure with AMOS

1. Key Concepts The full structural equation model Issue of item parceling Addressing evidence of multicollinearity Parameter change statistic Issue of model parsimony and nonsignificant parameter estimates Calculation and usefulness of the squared multiple correlation In this chapter, we take our first look at a full structural equation model (SEM). The hypothesis to be

1 Comments

21
Sep
  • 1
  • …
  • 50
  • 51
  • 52
  • 53
  • 54
  • 55
  • 56
  • …
  • 66
Theories of the firm
  • What is a Scientific Theory?What is a Scientific Theory?
  • Institutional TheoryInstitutional Theory
  • Resource dependence theoryResource dependence theory
  • Theory of Organizational structureTheory of Organizational structure
  • Property Rights TheoryProperty Rights Theory
  • Political Theories and ConceptsPolitical Theories and Concepts
  • Social Theories and ConceptsSocial Theories and Concepts
  • Contingency TheoryContingency Theory

Most Read in 30 days

Methodology & Skills
  • Qualitative methods: what and why use them?Qualitative methods: what and why use them?
  • Research methodology: a step-by-step guide for beginnersResearch methodology: a step-by-step guide for beginners
  • A Comparison of R, Python, SAS, SPSS and STATA for a Best Statistical SoftwareA Comparison of R, Python, SAS, SPSS and STATA for a Best Statistical Software
  • Quantitative Research: Definition, Methods, Types and ExamplesQuantitative Research: Definition, Methods, Types and Examples
  • Doing Management Research: A Comprehensive GuideDoing Management Research: A Comprehensive Guide
  • Create your professional WordPress website without codeCreate your professional WordPress website without code
  • Learn Programming Languages (JavaScript, Python, Java, PHP, C, C#, C++, HTML, CSS)Learn Programming Languages (JavaScript, Python, Java, PHP, C, C#, C++, HTML, CSS)

Connecting and sharing with us

... by your free and real actions.

hotlineTComment and discuss your ideas

Enthusiastic to comment and discuss the articles, videos on our website by sharing your knowledge and experiences.

hỗ trợ hkt Respect the copyright

Updating and sharing our articles and videos with sources from our channel.

hỗ trợ hkt Subscribe and like our articles and videos

Supporting us mentally and with your free and real actions on our channel.

HKT Channel - Science Theories

About HKT CHANNEL
About HKT CONSULTANT

Website Structure

Corporate Management
Startup & Entrepreneurship
Management Science
Theories of the firm

HKT Consultant JSC.

      "Knowledge - Experience - Success"
- Email: Info@phantran.net
- Website:
phantran.net

  • Home
  • Corporate Management
    • Entrepreneurship
      • Startup
      • Entrepreneurship
      • Growth of firm
    • Managing primary activities
      • Marketing
      • Sales Management
      • Retail Management
      • Import – Export
      • International Business
      • E-commerce
      • Project Management
      • Production Management
      • Quality Management
      • Logistics Management
      • Supply Chain Management
    • Managing support activities
      • Strategy
      • Human Resource Management
      • Organizational Culture
      • Information System Management
      • Corporate Finance
      • Stock Market
      • Accounting
      • Office Management
  • Economics of Firm
    • Theory of the Firm
    • Management Science
    • Microeconomics
  • Research Methodology
    • Methodology
      • Research Process
      • Experimental Research
      • Research Philosophy
      • Management Research
      • Writing a thesis
      • Writing a paper
    • Qualitative Research
      • Literature Review
      • Interview
      • Case Study
      • Action Research
      • Qualitative Content Analysis
      • Observation
      • Phenomenology
    • Quantitative Research
      • Statistics and Econometrics
      • Questionnaire Survey
      • Quantitative Content Analysis
      • Meta Analysis
      • Statistical Software
        • STATA
        • SPSS
        • SEM-AMOS
        • SmartPLS
        • Eviews
  • About us