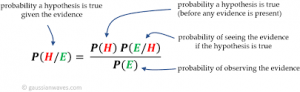
Skip to content
    • info@phantran.net
  • Connecting and sharing with us
  • -
  • About us
    • info@phantran.net
HKT ConsultantHKT Consultant
  • Home
  • Corporate Management
    • Entrepreneurship
      • Startup
      • Entrepreneurship
      • Growth of firm
    • Managing primary activities
      • Marketing
      • Sales Management
      • Retail Management
      • Import – Export
      • International Business
      • E-commerce
      • Project Management
      • Production Management
      • Quality Management
      • Logistics Management
      • Supply Chain Management
    • Managing support activities
      • Strategy
      • Human Resource Management
      • Organizational Culture
      • Information System Management
      • Corporate Finance
      • Stock Market
      • Accounting
      • Office Management
  • Economics of Firm
    • Theory of the Firm
    • Management Science
    • Microeconomics
  • Research Methodology
    • Methodology
      • Research Process
      • Experimental Research
      • Research Philosophy
      • Management Research
      • Writing a thesis
      • Writing a paper
    • Qualitative Research
      • Literature Review
      • Interview
      • Case Study
      • Action Research
      • Qualitative Content Analysis
      • Observation
      • Phenomenology
    • Quantitative Research
      • Statistics and Econometrics
      • Questionnaire Survey
      • Quantitative Content Analysis
      • Meta Analysis
      • Statistical Software
        • STATA
        • SPSS
        • SEM-AMOS
        • SmartPLS
        • Eviews
Summarizing Data for a Categorical Variable

1. Frequency Distribution We begin the discussion of how tabular and graphical displays can be used to summarize categorical data with the definition of a frequency distribution. FREQUENCY DISTRIBUTION A frequency distribution is a tabular summary of data showing the number (frequency) of observations in each of several nonoverlapping categories or classes. Let us

1 Comments

28
Aug
Summarizing Data for a Quantitative Variable

As defined in Section 2.1, a frequency distribution is a tabular summary of data showing the number (frequency) of observations in each of several nonoverlapping categories or classes. This definition holds for quantitative as well as categorical data. However, with quantitat­ive data we must be more careful in defining the nonoverlapping classes to be

28
Aug
Summarizing Data for Two Variables Using Tables

Thus far in this chapter, we have focused on using tabular and graphical displays to summarize the data for a single categorical or quantitative variable. Often a manager or decision maker needs to summarize the data for two variables in order to reveal the relationship—if any—between the vari­ables. In this section, we show how

28
Aug
Summarizing Data for Two Variables Using Graphical Displays

In the previous section we showed how a crosstabulation can be used to summarize the data for two variables and help reveal the relationship between the variables. In most cases, a graphical display is more useful for recognizing patterns and trends in the data. In this section, we introduce a variety of graphical displays

28
Aug
Data Visualization: Best Practices in Creating Effective Graphical Displays

Data visualization is a term used to describe the use of graphical displays to summarize and present information about a data set. The goal of data visualization is to communicate as effectively and clearly as possible, the key information about the data. In this section, we provide guidelines for creating an effective graphical display,

28
Aug
Measures of Location

1. Mean Perhaps the most important measure of location is the mean, or average value, for a variable. The mean provides a measure of central location for the data. If the data are for a sample, the mean is denoted by x; if the data are for a population, the mean is denoted by

28
Aug
Measures of Variability

In addition to measures of location, it is often desirable to consider measures of variability, or dispersion. For example, suppose that you are a purchasing agent for a large manufacturing firm and that you regularly place orders with two different suppliers. After several months of operation, you find that the mean number of days

1 Comments

28
Aug
Measures of Distribution Shape, Relative Location, and Detecting Outliers

We have described several measures of location and variability for data. In addition, it is often important to have a measure of the shape of a distribution. In Chapter 2 we noted that a histogram provides a graphical display showing the shape of a distribution. An important numerical measure of the shape of a

1 Comments

28
Aug
Five-Number Summaries and Boxplots

Summary statistics and easy-to-draw graphs based on summary statistics can be used to quickly summarize large quantities of data. In this section we show how five-number sum­maries and boxplots can be developed to identify several characteristics of a data set. 1. Five-Number Summary In a five-number summary, five numbers are used to summarize the

28
Aug
Measures of Association Between Two Variables

Thus far we have examined numerical methods used to summarize the data for one vari­able at a time. Often a manager or decision maker is interested in the relationship between two variables. In this section we present covariance and correlation as descriptive measures of the relationship between two variables. We begin by reconsidering the

2 Comments

28
Aug
Data Dashboards: Adding Numerical Measures to Improve Effectiveness

In Section 2.5 we provided an introduction to data visualization, a term used to describe the use of graphical displays to summarize and present information about a data set. The goal of data visualization is to communicate key information about the data as effectively and clearly as possible. One of the most widely used

28
Aug
Random Experiments, Counting Rules, and Assigning Probabilities

In discussing probability, we deal with experiments that have the following characteristics: The experimental outcomes are well defined, and in many cases can even be listed prior to conducting the experiment. On any single repetition or trial of the experiment, one and only one of the possible experimental outcomes will occur. The experimental outcome

28
Aug
Events and Their Probabilities

In the introduction to this chapter we used the term event much as it would be used in everyday language. Then, in Section 4.1 we introduced the concept of an experiment and its associated experimental outcomes or sample points. Sample points and events provide the foundation for the study of probability. As a result,

28
Aug
Some Basic Relationships of Probability

Given an event A, the complement of A is defined to be the event consisting of all sample points that are not in A. The complement of A is denoted by Ac. Figure 4.4 is a diagram, known as a Venn diagram, which illustrates the concept of a complement. The rectangular area represents the

28
Aug
Conditional Probability

Often, the probability of an event is influenced by whether a related event already occurred. Suppose we have an event A with probability P(A). If we obtain new informa­tion and learn that a related event, denoted by B, already occurred, we will want to take advantage of this information by calculating a new probability

2 Comments

28
Aug
Bayes’ Theorem

In the discussion of conditional probability, we indicated that revising probabilities when new information is obtained is an important phase of probability analysis. Often, we begin the analysis with initial or prior probability estimates for specific events of interest. Then, from sources such as a sample, a special report, or a product test, we

3 Comments

28
Aug
Random Variables

A random variable provides a means for describing experimental outcomes using numer- and its associated experimen- ical values. Random variables must assume numerical values. In effect, a random variable associates a numerical value with each possible experimental outcome. The particular numerical value of the random variable depends on the outcome of the experiment. A

30
Aug
Developing Discrete Probability Distributions

The probability distribution for a random variable describes how probabilities are distributed over the values of the random variable. For a discrete random variable x, a probability function, denoted by f(x), provides the probability for each value of the random variable. The classical, subjective, and relative frequency methods of assign­ing probabilities can be used

30
Aug
Expected Value and Variance

The expected value, or mean, of a random variable is a measure of the central location for the random variable. The formula for the expected value of a discrete random variable x follows. Both the notations E(x) and m are used to denote the expected value of a random variable. Equation (5.4) shows that

30
Aug
Bivariate Distributions, Covariance, and Financial Portfolios

A probability distribution involving two random variables is called a bivariate probability distribution. In discussing bivariate probability distributions, it is useful to think of a bivariate experiment. Each outcome for a bivariate experiment consists of two values, one for each random variable. For example, consider the bivariate experiment of rolling a pair of dice.

1 Comments

30
Aug
  • 1
  • …
  • 6
  • 7
  • 8
  • 9
  • 10
  • 11
  • 12
  • …
  • 14
Theories of the firm
  • Agency TheoryAgency Theory
  • Philosophical Theories and ConceptPhilosophical Theories and Concept
  • Definition of Theory of the FirmDefinition of Theory of the Firm
  • Theory of Competitive AdvantageTheory of Competitive Advantage
  • Organizational Ecology TheoryOrganizational Ecology Theory
  • The Invisible hand of Adam SmithThe Invisible hand of Adam Smith
  • List of Art movementsList of Art movements
  • What is a Scientific Theory?What is a Scientific Theory?

Most Read in 30 days

Methodology & Skills
  • Create your professional WordPress website without codeCreate your professional WordPress website without code
  • Qualitative methods: what and why use them?Qualitative methods: what and why use them?
  • Learn Programming Languages (JavaScript, Python, Java, PHP, C, C#, C++, HTML, CSS)Learn Programming Languages (JavaScript, Python, Java, PHP, C, C#, C++, HTML, CSS)
  • Doing Management Research: A Comprehensive GuideDoing Management Research: A Comprehensive Guide
  • A Comparison of R, Python, SAS, SPSS and STATA for a Best Statistical SoftwareA Comparison of R, Python, SAS, SPSS and STATA for a Best Statistical Software
  • Research methodology: a step-by-step guide for beginnersResearch methodology: a step-by-step guide for beginners
  • Quantitative Research: Definition, Methods, Types and ExamplesQuantitative Research: Definition, Methods, Types and Examples

Connecting and sharing with us

... by your free and real actions.

hotlineTComment and discuss your ideas

Enthusiastic to comment and discuss the articles, videos on our website by sharing your knowledge and experiences.

hỗ trợ hkt Respect the copyright

Updating and sharing our articles and videos with sources from our channel.

hỗ trợ hkt Subscribe and like our articles and videos

Supporting us mentally and with your free and real actions on our channel.

HKT Channel - Science Theories

About HKT CHANNEL
About HKT CONSULTANT

Website Structure

Corporate Management
Startup & Entrepreneurship
Management Science
Theories of the firm

HKT Consultant JSC.

      "Knowledge - Experience - Success"
- Email: Info@phantran.net
- Website:
phantran.net

  • Home
  • Corporate Management
    • Entrepreneurship
      • Startup
      • Entrepreneurship
      • Growth of firm
    • Managing primary activities
      • Marketing
      • Sales Management
      • Retail Management
      • Import – Export
      • International Business
      • E-commerce
      • Project Management
      • Production Management
      • Quality Management
      • Logistics Management
      • Supply Chain Management
    • Managing support activities
      • Strategy
      • Human Resource Management
      • Organizational Culture
      • Information System Management
      • Corporate Finance
      • Stock Market
      • Accounting
      • Office Management
  • Economics of Firm
    • Theory of the Firm
    • Management Science
    • Microeconomics
  • Research Methodology
    • Methodology
      • Research Process
      • Experimental Research
      • Research Philosophy
      • Management Research
      • Writing a thesis
      • Writing a paper
    • Qualitative Research
      • Literature Review
      • Interview
      • Case Study
      • Action Research
      • Qualitative Content Analysis
      • Observation
      • Phenomenology
    • Quantitative Research
      • Statistics and Econometrics
      • Questionnaire Survey
      • Quantitative Content Analysis
      • Meta Analysis
      • Statistical Software
        • STATA
        • SPSS
        • SEM-AMOS
        • SmartPLS
        • Eviews
  • About us