Skip to content
    • info@phantran.net
  • Connecting and sharing with us
  • -
  • About us
    • info@phantran.net
HKT ConsultantHKT Consultant
  • Home
  • Corporate Management
    • Entrepreneurship
      • Startup
      • Entrepreneurship
      • Growth of firm
    • Managing primary activities
      • Marketing
      • Sales Management
      • Retail Management
      • Import – Export
      • International Business
      • E-commerce
      • Project Management
      • Production Management
      • Quality Management
      • Logistics Management
      • Supply Chain Management
    • Managing support activities
      • Strategy
      • Human Resource Management
      • Organizational Culture
      • Information System Management
      • Corporate Finance
      • Stock Market
      • Accounting
      • Office Management
  • Economics of Firm
    • Theory of the Firm
    • Management Science
    • Microeconomics
  • Research Methodology
    • Methodology
      • Research Process
      • Experimental Research
      • Research Philosophy
      • Management Research
      • Writing a thesis
      • Writing a paper
    • Qualitative Research
      • Literature Review
      • Interview
      • Case Study
      • Action Research
      • Qualitative Content Analysis
      • Observation
      • Phenomenology
    • Quantitative Research
      • Statistics and Econometrics
      • Questionnaire Survey
      • Quantitative Content Analysis
      • Meta Analysis
      • Statistical Software
        • STATA
        • SPSS
        • SEM-AMOS
        • SmartPLS
        • Eviews
Analysis of Variance and the Completely Randomized Design

In this section we show how analysis of variance can be used to test for the equality of k population means for a completely randomized design. The general form of the hypotheses tested is We assume that a simple random sample of size Hj has been selected from each of the k populations or

30
Aug
Multiple Comparison Procedures

When we use analysis of variance to test whether the means of k populations are equal, rejection of the null hypothesis allows us to conclude only that the population means are not all equal. In some cases we will want to go a step further and determine where the differ­ences among means occur. The

30
Aug
Randomized Block Design

Thus far we have considered the completely randomized experimental design. Recall that to test for a difference among treatment means, we computed an F value by using the ratio A problem can arise whenever differences due to extraneous factors (ones not con­sidered in the experiment) cause the MSE term in this ratio to become

1 Comments

30
Aug
Factorial Experiment

The experimental designs we have considered thus far enable us to draw statistical con­clusions about one factor. However, in some experiments we want to draw conclusions about more than one variable or factor. A factorial experiment is an experimental design that allows simultaneous conclusions about two or more factors. The term factorial is used

30
Aug
Simple Linear Regression Model

Armand’s Pizza Parlors is a chain of Italian-food restaurants located in a five-state area. Armand’s most successful locations are near college campuses. The managers believe that quarterly sales for these restaurants (denoted by y) are related positively to the size of the student population (denoted by x); that is, restaurants near campuses with a

30
Aug
Least Squares Method for Simple Linear Regression

The least squares method is a procedure for using sample data to find the estimated regression equation. To illustrate the least squares method, suppose data were collected from a sample of 10 Armand’s Pizza Parlor restaurants located near college campuses. For the ith observation or restaurant in the sample, xi is the size of

2 Comments

30
Aug
Coefficient of Determination

For the Armand’s Pizza Parlors example, we developed the estimated regression equation y = 60 + 5x to approximate the linear relationship between the size of the student popu­lation x and quarterly sales y. A question now is: How well does the estimated regression equation fit the data? In this section, we show that

30
Aug
Simple Linear Regression Model Assumptions

In conducting a regression analysis, we begin by making an assumption about the appropri­ate model for the relationship between the dependent and independent variable(s). For the case of simple linear regression, the assumed regression model is Then the least squares method is used to develop values for β0 and β1, the estimates of the

30
Aug
Testing for Significance for Simple Linear Regression

In a simple linear regression equation, the mean or expected value of y is a linear func­tion of x: E(y) = β0 + β1x. If the value of β1 is zero, E(y) = β0 + (0)x = b0. In this case, the mean value of y does not depend on the value of x

30
Aug
Using the Estimated Simple Linear Regression Equation for Estimation and Prediction

When using the simple linear regression model, we are making an assumption about the relationship between x and y. We then use the least squares method to obtain the estimated simple linear regression equation. If a significant relationship exists between x and y and the coefficient of determination shows that the fit is good,

2 Comments

30
Aug
Computer Solution

Performing the regression analysis computations without the help of a computer can be quite time consuming. In this section we discuss how the computational burden can be minimized by using a computer software package such as JMP or Excel. Although the layout of the information may differ by computer software, the informa­tion shown in

1 Comments

30
Aug
Residual Analysis: Outliers and Influential Observations

In Section 14.8 we showed how residual analysis could be used to determine when viol­ations of assumptions about the regression model occur. In this section, we discuss how residual analysis can be used to identify observations that can be classified as outliers or as being especially influential in determining the estimated regression equation. Some

30
Aug
Multiple Regression Model

Multiple regression analysis is the study of how a dependent variable y is related to two or more independent variables. In the general case, we will use p to denote the number of independent variables. 1. Regression Model and Regression Equation The concepts of a regression model and a regression equation introduced in the

31
Aug
Least Squares Method for Multiple Regression

In Chapter 14, we used the least squares method to develop the estimated regression equation that best approximated the straight-line relationship between the dependent and independent variables. This same approach is used to develop the estimated multiple re­gression equation. The least squares criterion is restated as follows: The predicted values of the dependent variable

1 Comments

31
Aug
Multiple Coefficient of Determination in Multiple Regression

In simple linear regression, we showed that the total sum of squares can be partitioned into two components: the sum of squares due to regression and the sum of squares due to error. The same procedure applies to the sum of squares in multiple regression. Because of the computational difficulty in computing the three

2 Comments

31
Aug
Multiple Regression Model Assumptions

In Section 15.1 we introduced the following multiple regression model. The assumptions about the error term e in the multiple regression model parallel those for the simple linear regression model. To obtain more insight about the form of the relationship given by equation (15.11), consider the following two-independent-variable multiple regression equation. The graph of

31
Aug
Testing for Significance for Multiple Regression

In this section we show how to conduct significance tests for a multiple regression rela­tionship. The significance tests we used in simple linear regression were a t test and an F test. In simple linear regression, both tests provide the same conclusion; that is, if the null hypothesis is rejected, we conclude that b1

1 Comments

31
Aug
Using the Estimated Multiple Regression Equation for Estimation and Prediction

The procedures for estimating the mean value of y and predicting an individual value of y in multiple regression are similar to those in regression analysis involving one independent variable. First, recall that in Chapter 14 we showed that the point estimate of the expected value of y for a given value of x

31
Aug
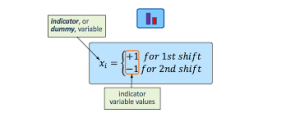
Categorical Independent Variables in Multiple Regression

Thus far, the examples we have considered involved quantitative independent variables such as student population, distance traveled, and number of deliveries. In many situations, however, we must work with categorical independent variables such as gender (male, female), method of payment (cash, credit card, check), and so on. The purpose of this sec­tion is to

31
Aug
Residual Analysis in Multiple Regression

In Chapter 14 we pointed out that standardized residuals are frequently used in residual plots and in the identification of outliers. The general formula for the standardized residual for observation i follows. The general formula for the standard deviation of residual i is defined as follows. As we stated in Chapter 14, the leverage

1 Comments

31
Aug
  • 1
  • …
  • 9
  • 10
  • 11
  • 12
  • 13
  • 14
Theories of the firm
  • What is a Scientific Theory?What is a Scientific Theory?
  • Becoming and evolution of a scientific theoryBecoming and evolution of a scientific theory
  • The Invisible hand of Adam SmithThe Invisible hand of Adam Smith
  • Hyper-competition theoryHyper-competition theory
  • List of Art movementsList of Art movements
  • Definition of Theory of the FirmDefinition of Theory of the Firm
  • Resource dependence theoryResource dependence theory
  • Theory of Organizational PowerTheory of Organizational Power

Most Read in 30 days

Methodology & Skills
  • Research methodology: a step-by-step guide for beginnersResearch methodology: a step-by-step guide for beginners
  • Create your professional WordPress website without codeCreate your professional WordPress website without code
  • Qualitative methods: what and why use them?Qualitative methods: what and why use them?
  • A Comparison of R, Python, SAS, SPSS and STATA for a Best Statistical SoftwareA Comparison of R, Python, SAS, SPSS and STATA for a Best Statistical Software
  • Quantitative Research: Definition, Methods, Types and ExamplesQuantitative Research: Definition, Methods, Types and Examples
  • Learn Programming Languages (JavaScript, Python, Java, PHP, C, C#, C++, HTML, CSS)Learn Programming Languages (JavaScript, Python, Java, PHP, C, C#, C++, HTML, CSS)
  • Doing Management Research: A Comprehensive GuideDoing Management Research: A Comprehensive Guide

Connecting and sharing with us

... by your free and real actions.

hotlineTComment and discuss your ideas

Enthusiastic to comment and discuss the articles, videos on our website by sharing your knowledge and experiences.

hỗ trợ hkt Respect the copyright

Updating and sharing our articles and videos with sources from our channel.

hỗ trợ hkt Subscribe and like our articles and videos

Supporting us mentally and with your free and real actions on our channel.

HKT Channel - Science Theories

About HKT CHANNEL
About HKT CONSULTANT

Website Structure

Corporate Management
Startup & Entrepreneurship
Management Science
Theories of the firm

HKT Consultant JSC.

      "Knowledge - Experience - Success"
- Email: Info@phantran.net
- Website:
phantran.net

  • Home
  • Corporate Management
    • Entrepreneurship
      • Startup
      • Entrepreneurship
      • Growth of firm
    • Managing primary activities
      • Marketing
      • Sales Management
      • Retail Management
      • Import – Export
      • International Business
      • E-commerce
      • Project Management
      • Production Management
      • Quality Management
      • Logistics Management
      • Supply Chain Management
    • Managing support activities
      • Strategy
      • Human Resource Management
      • Organizational Culture
      • Information System Management
      • Corporate Finance
      • Stock Market
      • Accounting
      • Office Management
  • Economics of Firm
    • Theory of the Firm
    • Management Science
    • Microeconomics
  • Research Methodology
    • Methodology
      • Research Process
      • Experimental Research
      • Research Philosophy
      • Management Research
      • Writing a thesis
      • Writing a paper
    • Qualitative Research
      • Literature Review
      • Interview
      • Case Study
      • Action Research
      • Qualitative Content Analysis
      • Observation
      • Phenomenology
    • Quantitative Research
      • Statistics and Econometrics
      • Questionnaire Survey
      • Quantitative Content Analysis
      • Meta Analysis
      • Statistical Software
        • STATA
        • SPSS
        • SEM-AMOS
        • SmartPLS
        • Eviews
  • About us