Skip to content
    • info@phantran.net
  • Connecting and sharing with us
  • -
  • About us
    • info@phantran.net
HKT ConsultantHKT Consultant
  • Home
  • Corporate Management
    • Entrepreneurship
      • Startup
      • Entrepreneurship
      • Growth of firm
    • Managing primary activities
      • Marketing
      • Sales Management
      • Retail Management
      • Import – Export
      • International Business
      • E-commerce
      • Project Management
      • Production Management
      • Quality Management
      • Logistics Management
      • Supply Chain Management
    • Managing support activities
      • Strategy
      • Human Resource Management
      • Organizational Culture
      • Information System Management
      • Corporate Finance
      • Stock Market
      • Accounting
      • Office Management
  • Economics of Firm
    • Theory of the Firm
    • Management Science
    • Microeconomics
  • Research Methodology
    • Methodology
      • Research Process
      • Experimental Research
      • Research Philosophy
      • Management Research
      • Writing a thesis
      • Writing a paper
    • Qualitative Research
      • Literature Review
      • Interview
      • Case Study
      • Action Research
      • Qualitative Content Analysis
      • Observation
      • Phenomenology
    • Quantitative Research
      • Statistics and Econometrics
      • Questionnaire Survey
      • Quantitative Content Analysis
      • Meta Analysis
      • Statistical Software
        • STATA
        • SPSS
        • SEM-AMOS
        • SmartPLS
        • Eviews
Inferences About the Difference Between Two Population Means: σ1 and σ2 Known

Letting μ1 denote the mean of population 1 and μ2 denote the mean of population 2, we will focus on inferences about the difference between the means: μ1 – μ2. To make an inference about this difference, we select a simple random sample of n1 units from popula­tion 1 and a second simple random

30
Aug
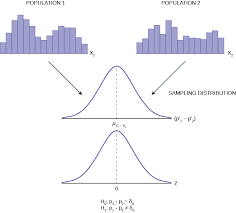
Inferences About the Difference Between Two Population Means: s1 and s2 Unknown

In this section we extend the discussion of inferences about the difference between two population means to the case when the two population standard deviations, s1 and s2, are unknown. In this case, we will use the sample standard deviations, s1 and s2, to estimate the unknown population standard deviations. When we use the

30
Aug
Inferences About the Difference Between Two Population Means: Matched Samples

Suppose employees at a manufacturing company can use two different methods to per­form a production task. To maximize production output, the company wants to iden­tify the method with the smaller population mean completion time. Let m1 denote the population mean completion time for production method 1 and m2 denote the population mean completion time

30
Aug
Inferences About the Difference Between Two Population Proportions

Letting p1 denote the proportion for population 1 and p2 denote the proportion for population 2, we next consider inferences about the difference between the two population proportions: P1 – P2. To make an inference about this difference, we will select two independent random samples consisting of n1 units from population 1 and n2

30
Aug
Inferences About a Population Variance

The sample variance is the point estimator of the population variance s2. In using the sample variance as a basis for making inferences about a population variance, the sampling distribution of the quan­tity (n – 1)s1/s2 is helpful. This sampling distribution is described as follows. Figure 11.1 shows some possible forms of the sampling

30
Aug
Inferences About Two Population Variances

In some statistical applications we may want to compare the variances in product quality resulting from two different production processes, the variances in assembly times for two assembly methods, or the variances in temperatures for two heating devices. In making comparisons about the two population variances, we will be using data collected from two

30
Aug
Testing the Equality of Population Proportions for Three or More Populations

In this section, we show how the chi-square (^2) test statistic can be used to make statist­ical inferences about the equality of population proportions for three or more populations. Using the notation the hypotheses for the equality of population proportions for k > 3 populations are as follows: If the sample data and the

1 Comments

30
Aug
Test of Independence

An important application of a chi-square test involves using sample data to test for the independence of two categorical variables. For this test we take one sample from a pop­ulation and record the observations for two categorical variables. We will summarize the data by counting the number of responses for each combination of a

30
Aug
Goodness of Fit Test

In this section we use a chi-square test to determine whether a population being sam­pled has a specific probability distribution. We first consider a population with a histor­ical multinomial probability distribution and use a goodness of fit test to determine if new sample data indicate there has been a change in the population distribution

1 Comments

30
Aug
An Introduction to Experimental Design and Analysis of Variance

As an example of an experimental statistical study, let us consider the problem facing Chemitech, Inc. Chemitech developed a new filtration system for municipal water supplies. The components for the new filtration system will be purchased from several suppliers, and Chemitech will assemble the components at its plant in Columbia, South Carolina. The industrial

1 Comments

30
Aug
Analysis of Variance and the Completely Randomized Design

In this section we show how analysis of variance can be used to test for the equality of k population means for a completely randomized design. The general form of the hypotheses tested is We assume that a simple random sample of size Hj has been selected from each of the k populations or

30
Aug
Multiple Comparison Procedures

When we use analysis of variance to test whether the means of k populations are equal, rejection of the null hypothesis allows us to conclude only that the population means are not all equal. In some cases we will want to go a step further and determine where the differ­ences among means occur. The

30
Aug
Randomized Block Design

Thus far we have considered the completely randomized experimental design. Recall that to test for a difference among treatment means, we computed an F value by using the ratio A problem can arise whenever differences due to extraneous factors (ones not con­sidered in the experiment) cause the MSE term in this ratio to become

1 Comments

30
Aug
Factorial Experiment

The experimental designs we have considered thus far enable us to draw statistical con­clusions about one factor. However, in some experiments we want to draw conclusions about more than one variable or factor. A factorial experiment is an experimental design that allows simultaneous conclusions about two or more factors. The term factorial is used

30
Aug
Simple Linear Regression Model

Armand’s Pizza Parlors is a chain of Italian-food restaurants located in a five-state area. Armand’s most successful locations are near college campuses. The managers believe that quarterly sales for these restaurants (denoted by y) are related positively to the size of the student population (denoted by x); that is, restaurants near campuses with a

30
Aug
Least Squares Method for Simple Linear Regression

The least squares method is a procedure for using sample data to find the estimated regression equation. To illustrate the least squares method, suppose data were collected from a sample of 10 Armand’s Pizza Parlor restaurants located near college campuses. For the ith observation or restaurant in the sample, xi is the size of

2 Comments

30
Aug
Coefficient of Determination

For the Armand’s Pizza Parlors example, we developed the estimated regression equation y = 60 + 5x to approximate the linear relationship between the size of the student popu­lation x and quarterly sales y. A question now is: How well does the estimated regression equation fit the data? In this section, we show that

30
Aug
Simple Linear Regression Model Assumptions

In conducting a regression analysis, we begin by making an assumption about the appropri­ate model for the relationship between the dependent and independent variable(s). For the case of simple linear regression, the assumed regression model is Then the least squares method is used to develop values for β0 and β1, the estimates of the

30
Aug
Testing for Significance for Simple Linear Regression

In a simple linear regression equation, the mean or expected value of y is a linear func­tion of x: E(y) = β0 + β1x. If the value of β1 is zero, E(y) = β0 + (0)x = b0. In this case, the mean value of y does not depend on the value of x

30
Aug
Using the Estimated Simple Linear Regression Equation for Estimation and Prediction

When using the simple linear regression model, we are making an assumption about the relationship between x and y. We then use the least squares method to obtain the estimated simple linear regression equation. If a significant relationship exists between x and y and the coefficient of determination shows that the fit is good,

2 Comments

30
Aug
  • 1
  • 2
  • 3
  • 4
  • 5
  • 6
  • 7
Theories of the firm
  • Theory of the Visible HandTheory of the Visible Hand
  • Contingency TheoryContingency Theory
  • Evolutionary Theory of the FirmEvolutionary Theory of the Firm
  • List of Theological Belief SystemsList of Theological Belief Systems
  • Economic Theories and ConceptsEconomic Theories and Concepts
  • Hyper-competition theoryHyper-competition theory
  • Theory of Organizational PowerTheory of Organizational Power
  • Property Rights TheoryProperty Rights Theory

Most Read in 30 days

Methodology & Skills
  • Qualitative methods: what and why use them?Qualitative methods: what and why use them?
  • A Comparison of R, Python, SAS, SPSS and STATA for a Best Statistical SoftwareA Comparison of R, Python, SAS, SPSS and STATA for a Best Statistical Software
  • Quantitative Research: Definition, Methods, Types and ExamplesQuantitative Research: Definition, Methods, Types and Examples
  • Research methodology: a step-by-step guide for beginnersResearch methodology: a step-by-step guide for beginners
  • Create your professional WordPress website without codeCreate your professional WordPress website without code
  • Doing Management Research: A Comprehensive GuideDoing Management Research: A Comprehensive Guide
  • Learn Programming Languages (JavaScript, Python, Java, PHP, C, C#, C++, HTML, CSS)Learn Programming Languages (JavaScript, Python, Java, PHP, C, C#, C++, HTML, CSS)

Connecting and sharing with us

... by your free and real actions.

hotlineTComment and discuss your ideas

Enthusiastic to comment and discuss the articles, videos on our website by sharing your knowledge and experiences.

hỗ trợ hkt Respect the copyright

Updating and sharing our articles and videos with sources from our channel.

hỗ trợ hkt Subscribe and like our articles and videos

Supporting us mentally and with your free and real actions on our channel.

HKT Channel - Science Theories

About HKT CHANNEL
About HKT CONSULTANT

Website Structure

Corporate Management
Startup & Entrepreneurship
Management Science
Theories of the firm

HKT Consultant JSC.

      "Knowledge - Experience - Success"
- Email: Info@phantran.net
- Website:
phantran.net

  • Home
  • Corporate Management
    • Entrepreneurship
      • Startup
      • Entrepreneurship
      • Growth of firm
    • Managing primary activities
      • Marketing
      • Sales Management
      • Retail Management
      • Import – Export
      • International Business
      • E-commerce
      • Project Management
      • Production Management
      • Quality Management
      • Logistics Management
      • Supply Chain Management
    • Managing support activities
      • Strategy
      • Human Resource Management
      • Organizational Culture
      • Information System Management
      • Corporate Finance
      • Stock Market
      • Accounting
      • Office Management
  • Economics of Firm
    • Theory of the Firm
    • Management Science
    • Microeconomics
  • Research Methodology
    • Methodology
      • Research Process
      • Experimental Research
      • Research Philosophy
      • Management Research
      • Writing a thesis
      • Writing a paper
    • Qualitative Research
      • Literature Review
      • Interview
      • Case Study
      • Action Research
      • Qualitative Content Analysis
      • Observation
      • Phenomenology
    • Quantitative Research
      • Statistics and Econometrics
      • Questionnaire Survey
      • Quantitative Content Analysis
      • Meta Analysis
      • Statistical Software
        • STATA
        • SPSS
        • SEM-AMOS
        • SmartPLS
        • Eviews
  • About us