Skip to content
    • info@phantran.net
  • Connecting and sharing with us
  • -
  • About us
    • info@phantran.net
HKT ConsultantHKT Consultant
  • Home
  • Corporate Management
    • Entrepreneurship
      • Startup
      • Entrepreneurship
      • Growth of firm
    • Managing primary activities
      • Marketing
      • Sales Management
      • Retail Management
      • Import – Export
      • International Business
      • E-commerce
      • Project Management
      • Production Management
      • Quality Management
      • Logistics Management
      • Supply Chain Management
    • Managing support activities
      • Strategy
      • Human Resource Management
      • Organizational Culture
      • Information System Management
      • Corporate Finance
      • Stock Market
      • Accounting
      • Office Management
  • Economics of Firm
    • Theory of the Firm
    • Management Science
    • Microeconomics
  • Research Methodology
    • Methodology
      • Research Process
      • Experimental Research
      • Research Philosophy
      • Management Research
      • Writing a thesis
      • Writing a paper
    • Qualitative Research
      • Literature Review
      • Interview
      • Case Study
      • Action Research
      • Qualitative Content Analysis
      • Observation
      • Phenomenology
    • Quantitative Research
      • Statistics and Econometrics
      • Questionnaire Survey
      • Quantitative Content Analysis
      • Meta Analysis
      • Statistical Software
        • STATA
        • SPSS
        • SEM-AMOS
        • SmartPLS
        • Eviews
Logistic Regression

In many regression applications, the dependent variable may only assume two discrete values. For instance, a bank might want to develop an estimated regression equation for predicting whether a person will be approved for a credit card. The dependent variable can be coded as y = 1 if the bank approves the request for

31
Aug
General Linear Model

Suppose we collected data for one dependent variable y and k independent variables x1, x2, . . . , xk. Our objective is to use these data to develop an estimated regression equation that provides the best relationship between the dependent and independent variables. As a general framework for developing more complex relationships among

31
Aug
Determining When to Add or Delete Variables

In this section we will show how an F test can be used to determine whether it is advant­ageous to add one or more independent variables to a multiple regression model. This test is based on a determination of the amount of reduction in the error sum of squares resulting from adding one or

1 Comments

31
Aug
Analysis of a Larger Problem

In introducing multiple regression analysis, we used the Butler Trucking example extensively. The small size of this problem was an advantage in exploring introductory concepts but would make it difficult to illustrate some of the variable selection issues involved in model building. To provide an illustration of the variable selection procedures discussed in the

31
Aug
Variable Selection Procedures

In this section we discuss four variable selection procedures: stepwise regression, for­ward selection, backward elimination, and best-subsets regression. Given a data set with several possible independent variables, we can use these procedures to identify which in­dependent variables provide the best model. The first three procedures are iterative; at each step of the procedure a

31
Aug
Multiple Regression Approach to Experimental Design

In Section 15.7 we discussed the use of dummy variables in multiple regression analysis. In this section we show how the use of dummy variables in a multiple regression equation can provide another approach to solving experimental design problems. We will demonstrate the multiple regression approach to experimental design by applying it to the

31
Aug
Autocorrelation and the Durbin-Watson Test

Often, the data used for regression studies in business and economics are collected over time. It is not uncommon for the value of y at time t, denoted by y, to be related to the value of y at previous time periods. In such cases, we say autocorrelation (also called serial correlation) is present

31
Aug
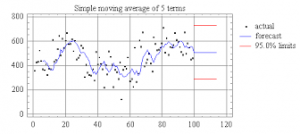
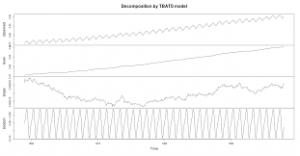
Time Series Patterns

A time series is a sequence of observations on a variable measured at successive points in time or over successive periods of time. The measurements may be taken every hour, day, week, month, or year, or at any other regular interval.[1] The pattern of the data is an important factor in understanding how the

31
Aug
Forecast Accuracy with Time Series Analysis

In this section we begin by developing forecasts for the gasoline time series shown in Table 17.1 using the simplest of all the forecasting methods: an approach that uses the most recent week’s sales volume as the forecast for the next week. For instance, the dis­tributor sold 17 thousand gallons of gasoline in week

31
Aug
Moving Averages and Exponential Smoothing in Time Series Analysis

In this section, we discuss three forecasting methods that are appropriate for a time series with a horizontal pattern: moving averages, weighted moving averages, and exponential smoothing. These methods also adapt well to changes in the level of a horizontal pattern such as we saw with the extended gasoline sales time series (Table 17.2

4 Comments

31
Aug
Trend Projection with Time Series Analysis

We present two forecasting methods in this section that are appropriate for time series exhibiting a trend pattern. First, we show how simple linear regression can be used to forecast a time series with a linear trend. Next we show how the curve-fitting capability of regression analysis can also be used to forecast time

31
Aug
Seasonality and Trend in Time Series Analysis

In this section we show how to develop forecasts for a time series that has a seasonal pattern. To the extent that seasonality exists, we need to incorporate it into our forecasting models to ensure accurate forecasts. We begin by considering a seasonal time series with no trend and then discuss how to model

1 Comments

31
Aug
Time Series Decomposition

In this section we turn our attention to what is called time series decomposition. Time series decomposition can be used to separate or decompose a time series into seasonal, trend, and irregular components. While this method can be used for forecasting, its primary applicability is to get a better understanding of the time series.

5 Comments

31
Aug
Sign Test

The sign test is a versatile nonparametric method for hypothesis testing that uses the binomial distribution with p = .50 as the sampling distribution. It does not require an assumption about the distribution of the population. In this section we present two applications of the sign test: one involving a hypothesis test about a

31
Aug
Wilcoxon Signed-Rank

In Chapter 10, we introduced a matched-sample experimental design where each of n experimental units provided a pair of observations, one from population 1 and one from population 2. The parametric test for this experiment requires quantitative data and the assumption that the differences between the paired observations are normally distributed. The t distribution

31
Aug
Mann-Whitney-Wilcoxon

In Chapter 10, we introduced a procedure for conducting a hypothesis test about the difference between the means of two populations using two independent samples, one from population 1 and one from population 2. This parametric test required quantitative data and the assumption that both populations had a normal distribution. In the case where

31
Aug
Kruskal-Wallis Test

In this section we extend the nonparametric procedures to hypothesis tests involving three or more populations. We considered a parametric test for this situation in Chapter 13 when we used quantitative data and assumed that the populations had nor­mal distributions with the same standard deviations. Based on an independent random sample from each population,

31
Aug
Rank Correlation

The Pearson product moment correlation coefficient introduced in Chapter 3 is a measure of the linear association between two variables using quantitative data. In this section, we provide a correlation measure of association between two variables when ordinal or rank-ordered data are available. The Spearman rank-correlation coefficient has been developed for this purpose. Let

31
Aug
Problem Formulation

The first step in the decision analysis process is problem formulation. We begin with a verbal statement of the problem. We then identify the decision alternatives, the uncertain future events, referred to as chance events, and the consequences associated with each decision alternative and each chance event outcome. Let us begin by considering a

31
Aug
Decision Making with Probabilities

Once we define the decision alternatives and the states of nature for the chance events, we can focus on determining probabilities for the states of nature. The classical method, the relative frequency method, or the subjective method of assigning probabilities may be used to identify these probabilities. After determining the appropriate probabilities, we show

1 Comments

31
Aug
  • 1
  • …
  • 10
  • 11
  • 12
  • 13
  • 14
Theories of the firm
  • Decision TheoryDecision Theory
  • Nature and scope of scienceNature and scope of science
  • Contingency TheoryContingency Theory
  • Social Science: meaning, nature and scopeSocial Science: meaning, nature and scope
  • Organizational learning theoryOrganizational learning theory
  • Lời dẫn
  • Plan d’actions
  • Organizational Ecology TheoryOrganizational Ecology Theory

Most Read in 30 days

Methodology & Skills
  • A Comparison of R, Python, SAS, SPSS and STATA for a Best Statistical SoftwareA Comparison of R, Python, SAS, SPSS and STATA for a Best Statistical Software
  • Qualitative methods: what and why use them?Qualitative methods: what and why use them?
  • Quantitative Research: Definition, Methods, Types and ExamplesQuantitative Research: Definition, Methods, Types and Examples
  • Create your professional WordPress website without codeCreate your professional WordPress website without code
  • Learn Programming Languages (JavaScript, Python, Java, PHP, C, C#, C++, HTML, CSS)Learn Programming Languages (JavaScript, Python, Java, PHP, C, C#, C++, HTML, CSS)
  • Doing Management Research: A Comprehensive GuideDoing Management Research: A Comprehensive Guide
  • Research methodology: a step-by-step guide for beginnersResearch methodology: a step-by-step guide for beginners

Connecting and sharing with us

... by your free and real actions.

hotlineTComment and discuss your ideas

Enthusiastic to comment and discuss the articles, videos on our website by sharing your knowledge and experiences.

hỗ trợ hkt Respect the copyright

Updating and sharing our articles and videos with sources from our channel.

hỗ trợ hkt Subscribe and like our articles and videos

Supporting us mentally and with your free and real actions on our channel.

HKT Channel - Science Theories

About HKT CHANNEL
About HKT CONSULTANT

Website Structure

Corporate Management
Startup & Entrepreneurship
Management Science
Theories of the firm

HKT Consultant JSC.

      "Knowledge - Experience - Success"
- Email: Info@phantran.net
- Website:
phantran.net

  • Home
  • Corporate Management
    • Entrepreneurship
      • Startup
      • Entrepreneurship
      • Growth of firm
    • Managing primary activities
      • Marketing
      • Sales Management
      • Retail Management
      • Import – Export
      • International Business
      • E-commerce
      • Project Management
      • Production Management
      • Quality Management
      • Logistics Management
      • Supply Chain Management
    • Managing support activities
      • Strategy
      • Human Resource Management
      • Organizational Culture
      • Information System Management
      • Corporate Finance
      • Stock Market
      • Accounting
      • Office Management
  • Economics of Firm
    • Theory of the Firm
    • Management Science
    • Microeconomics
  • Research Methodology
    • Methodology
      • Research Process
      • Experimental Research
      • Research Philosophy
      • Management Research
      • Writing a thesis
      • Writing a paper
    • Qualitative Research
      • Literature Review
      • Interview
      • Case Study
      • Action Research
      • Qualitative Content Analysis
      • Observation
      • Phenomenology
    • Quantitative Research
      • Statistics and Econometrics
      • Questionnaire Survey
      • Quantitative Content Analysis
      • Meta Analysis
      • Statistical Software
        • STATA
        • SPSS
        • SEM-AMOS
        • SmartPLS
        • Eviews
  • About us